
Immobilisation Free In-solution Kinetics Using Flow Induced Dispersion Analysis (FIDA)
INTRODUCTION
Understanding the interaction between biomolecules is of great interest within biomolecular research. A key parameter is to understand the affinity between drug and target, but also quantifying the underlying kinetics that define the affinity. Kinetics describes at which rate the drug and target interact. For a 1:1 interaction the interaction is described as follows:

Where t denotes time. Instead of looking at a single timepoint, one can also look at the change of complex concentration [AB] over time:

Where kon is the rate constant for the association of the complex and koff is the rate constant for the dissociation of the complex. By looking at a specific time where the rates are equal, we observe:

Where eq means equilibrium, hence there is no net change in the system. At equilibrium the dissociation constant, or the affinity, is described as the following:
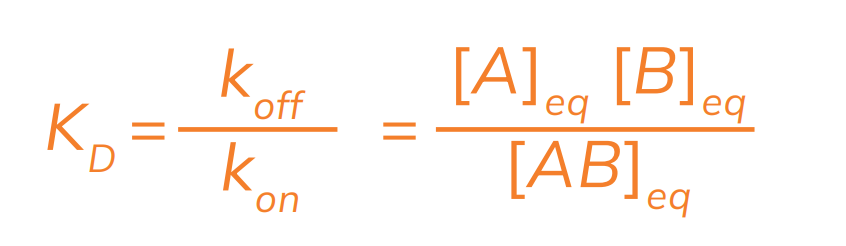
Where KD is the dissociation constant and describes the affinity between A and B.
Technologies for assessing kinetics can be divided into two groups: surface-based and in-solution based techniques.
In this tech note we describe a new technology for in solution kinetics quantification. The technique is based on flow induced dispersion analysis and it allows determination of kon and koff using very small sample volumes (nL-to-microliter). The results are compared to Surface Plasmon Resonance (SPR), a surface-based technique often recognised as the golden standard to evaluate kinetics.
This tech note will give an overview of how to utilise FIDA for determining the kinetics of a system. FIDA measures the diffusivity of a species, which has been shown in multiple cases. The diffusivity can also be used to obtain the hydrodynamic radius by using the Stokes Einstein relation.
The protocol involves two distinct analysis steps:
STEP 1:
By premixing the two interacting molecules we can ensure that the equilibrium has been established prior to measuring the diffusivity, thus eliminating any time components. Doing so we get the following equation:
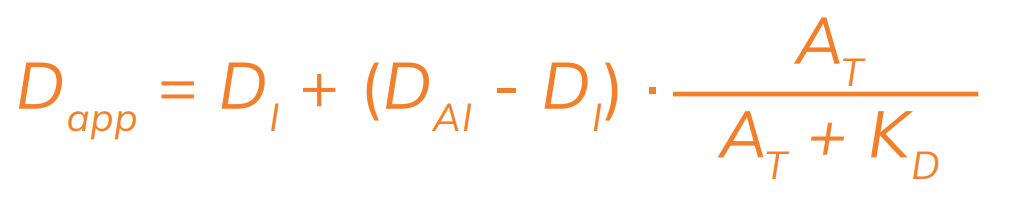
Where, Dapp is the apparent diffusivity observed at a given concentration of analyte (A) and constant concentration of indicator (I). AT describes the total analyte concentration, whereas DI and DAI are the diffusivity of the indicator and the indicator-analyte complex, respectively. KD is the equilibrium affinity constant. Using a premix protocol at different AT, the equilibrium KD is thus determined.
STEP 2:
In contrast, if the interacting molecules are not allowed to reach equilibrium prior to detection, we need to extend the model to describe the formation of complex with time, which depends on the kon and the koff as shown below.

Where kon and koff are introduced along with t, describing the time, and the remaining components remain identical as in the equilibrium case.
One can express the koff as a product of the KD and kon, hence leaving only 1 fitting parameter, namely kon. Doing so results in the following expression:

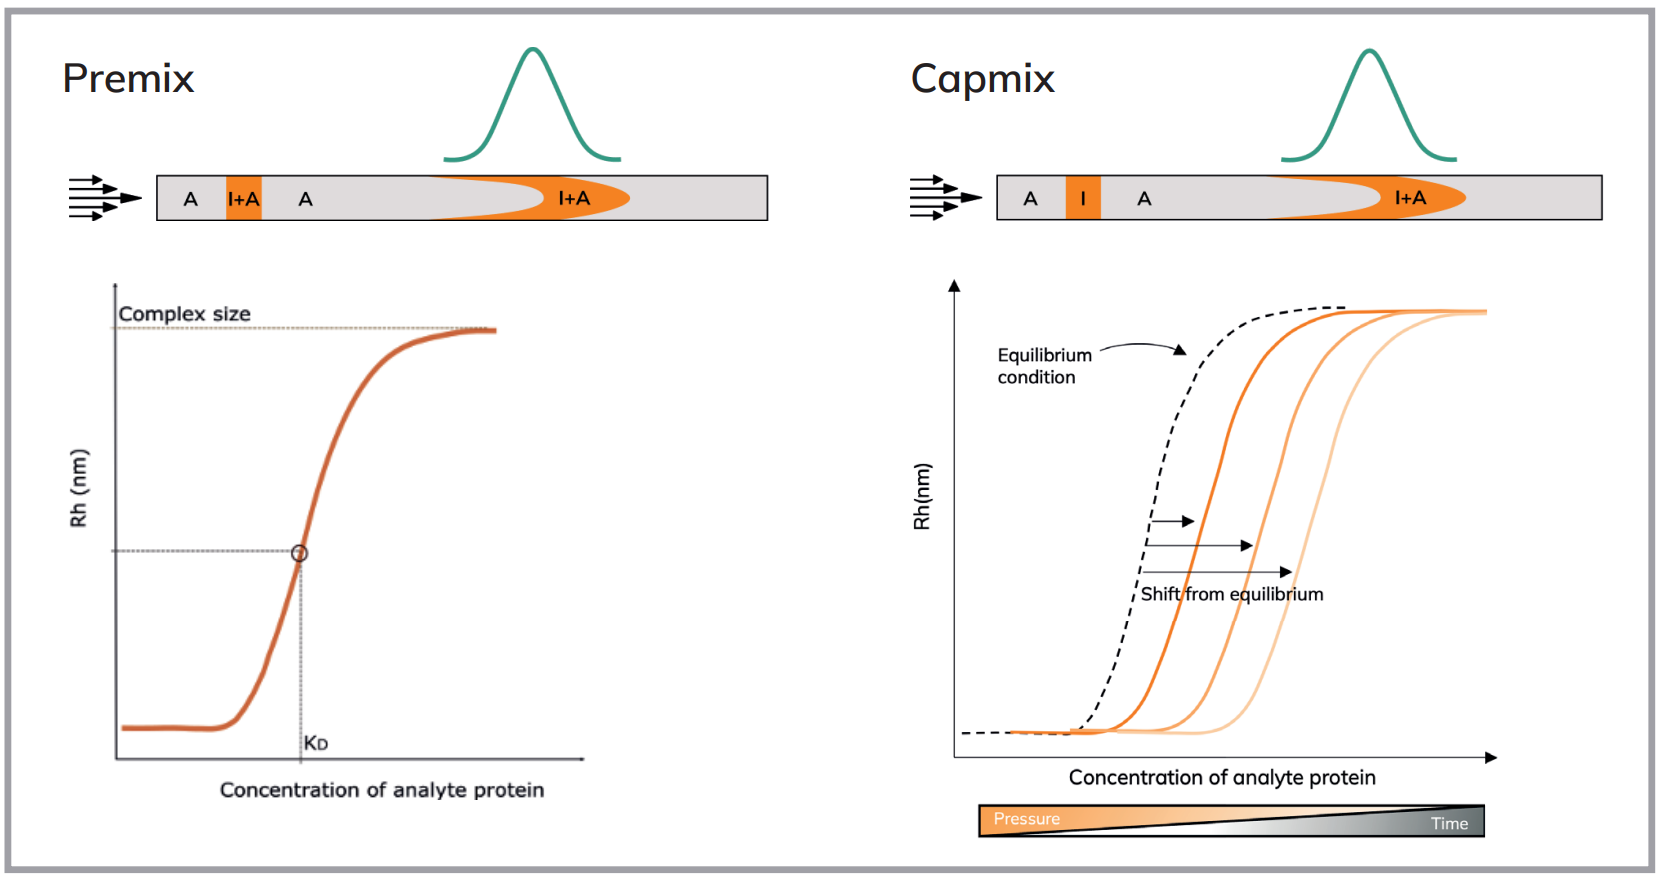
The last thing that should be addressed is the time component in the equation above. The Fida Neo instrument is a pressure driven instrument; hence the user is in full control of how much time is allowed for the reagents to interact in the capillary as the pressure controls the flow rate. By increasing the pressure, less time is allowed for the reaction, hence shifting the reaction away from the equilibrium.
Figure 1 shows the principle behind this when applied to a full titration series. The left image in Figure 1 shows how the apparent size changes (can be calculated from the apparent diffusivity) upon titrating increasing amounts of binding partner until saturation is reached at full complex formation. From the titration curve, the KD is extracted as shown. This binding curve is projected to the right image in Figure 1 shown as a dashed line. Furthermore, additional binding curves are drawn in here as well. These represent the same interaction, however, the reaction has been controlled to a certain amount of time, making sure the reaction is not at equilibrium. This results in a shift in the apparent KD toward a weaker interaction. If the shift in observed KD is sufficiently different from the premix, it is possible to estimate the kinetics of the system.
MATERIAL & METHODS
Fida Neo equipped with a 480 nm LED fluorescence detector. A Fida dynamic coated capillary (L: 1 m, ID: 75 µm, Leff: 84 cm). The buffer used was PBS for all experiments. Indicator concentration was 20 nM affibody labelled with ALC480. The experiment was run as either a premix at 400 mBar pressure or capillary mix with pressures ranging from 50 to 600 mBar. The experiments were performed in triplicates and the data was analysed using Fida Software V3.0 with a standard fit to the raw data and the kinetics module for kinetics data.
The SPR data was obtained using a BiacoreX100. A CM5 chip was used and the immobilisation of the affibody was performed with pH screen ending at pH 4.5 for optimal immobilisation concentration of 1µg/mL. PBS-T was used for these experiments.
RESULTS
As a fi rst step, a premix experiment with a fi xed indicator concentration of 20 nM of ALC488-affibody was used against 0 – 1000 nM rituximab to obtain an equillibrium KD of 0.31 nM (data not shown). Secondly, a series of capillary mixing (capmix) experiments were carried out at two different mobilisation conditions of 400 mBar and 600 mBar. Upon applying a mobilisation pressure of 400 mBar, the affi body and rituximab were allowed to react for 110 seconds in the Fida capillary. The alternative condition, at 600 mBar mobilisation pressure, enabled the reaction time to be 74 seconds.
Figure 2 shows the results of the capmix experiments, where the shift from equilibrium state can be clearly seen at two different mobilisation conditions, where 600 mBar shows an apparent KD of approximately 6.18 nM compared to 4.12 nM for 400 mBar condition. Both capmix cases illustrated in Figure 2 reported a weaker KD compared to the premix state KD of 0.31 nM. Table 1 shows the extracted KD for each of the mobilisation pressures shown in Figure 2.
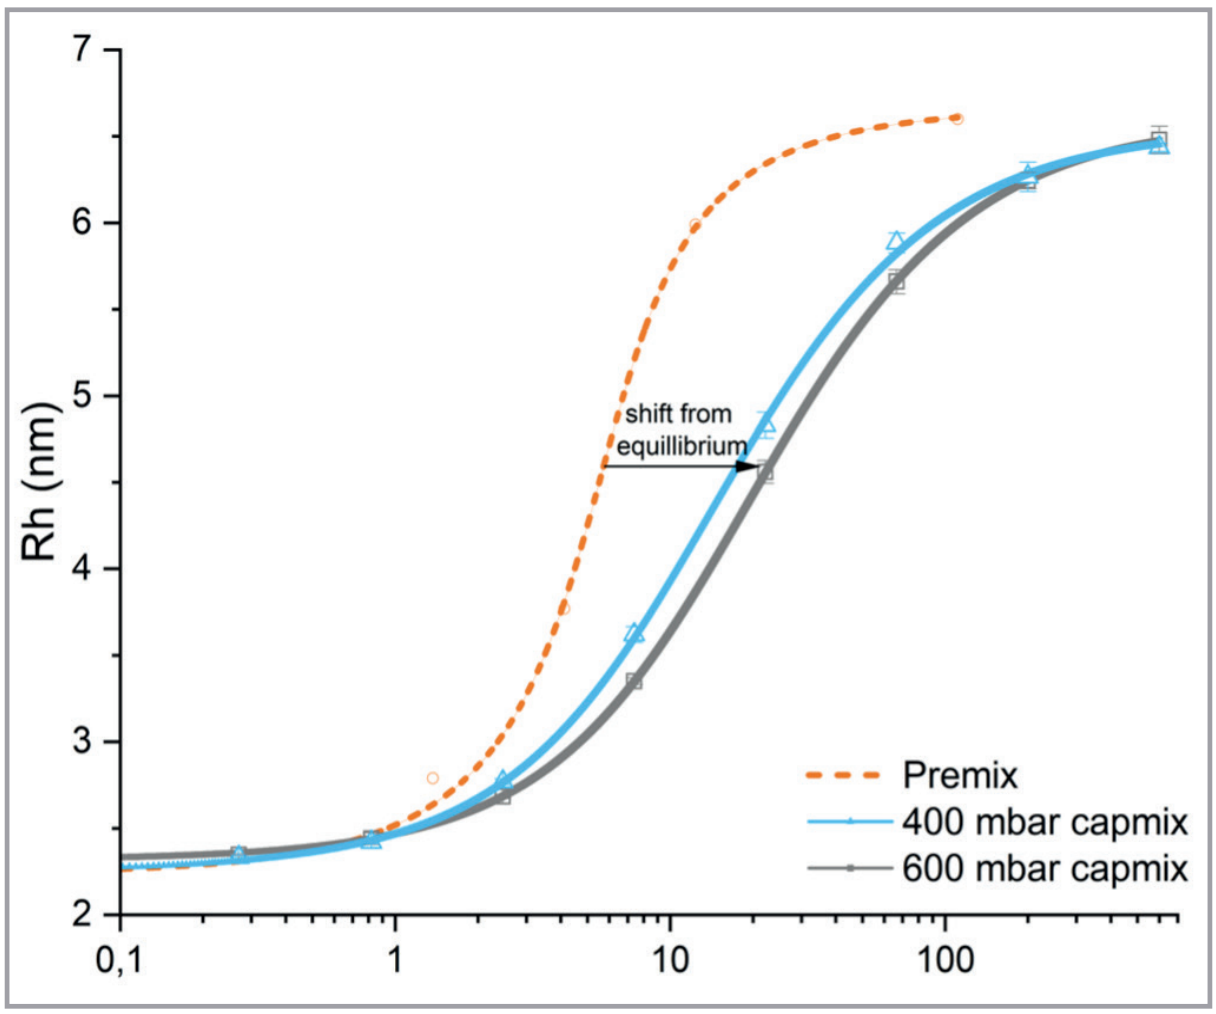
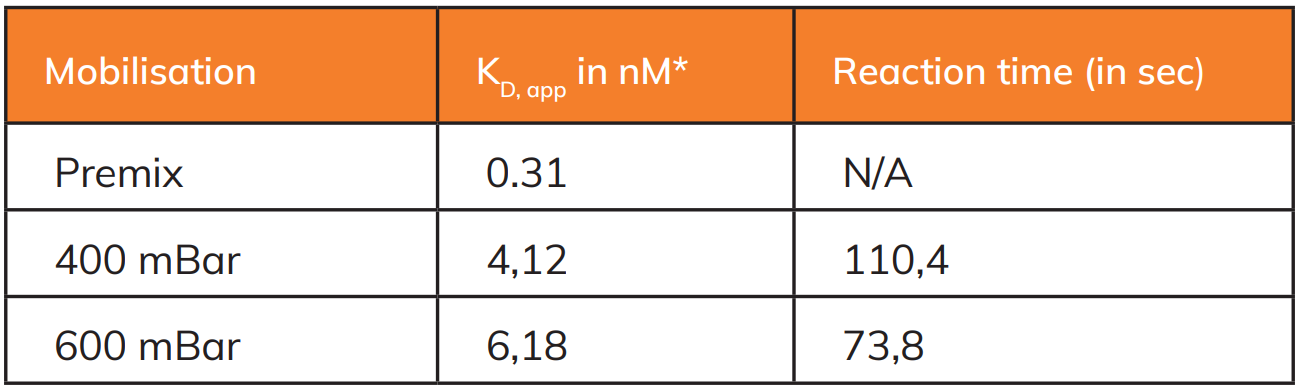
At 600 mBar, we observe a 20-fold difference in KD, app, which is signifi cantly lower degree of binding than at equilibrium, indicating a shift from equilibrium at this condition. Thus, the 600 mBar capmix data was analysed using the Fidabio kinetics module shown in Figure 3.
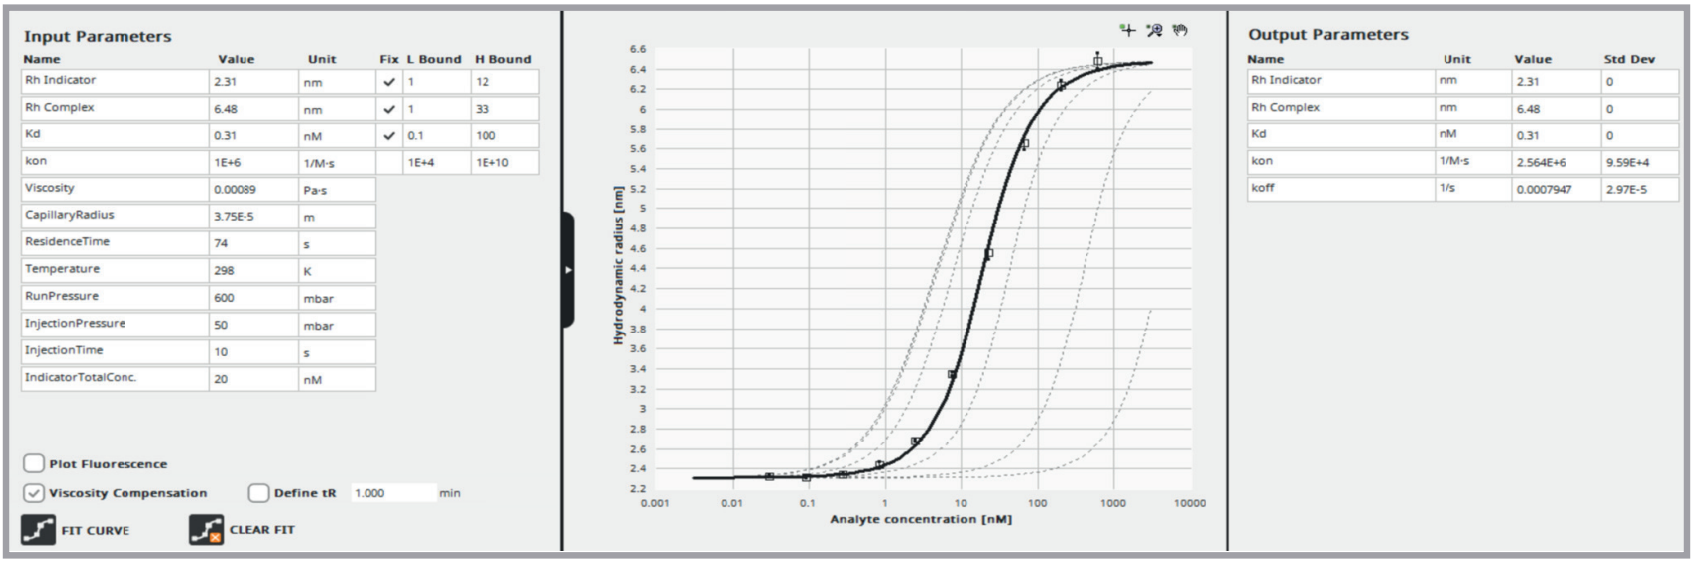
The interface of kinetics module is divided into 3 sections. The left section in Figure 3 concerns the input parameters, where the indicator size, complex size and equilibrium (premix) KD are all known parameters, hence these parameters are fixed. This leaves kon as the only fitting parameter. The remaining input parameters are constants specific to the experiment, such as temperature, injection pressure, mobilisation pressure, capillary dimensions, viscosity, indicator concentration, injection time of the indicator and the sample residence time. All of these parameters are either controlled by the user or are known prior to the experiment.
By entering the various parameters for 600 mBar mobilisation condition we were able to extract a kon of 2.6x10⁶ M-1s-1 with less than 5% error bars and a koff of 0.0008 s-1 (figure 3). To test if the other mobilisations/reaction conditions would give similar results, we also analysed the system at 400 mBar (with reaction time of 110 sec) condition from Figure 2, and the results are compiled in Table S1. In addition to the two reaction conditions, we also performed the same assay at a further longer reaction time of 222 seconds (at 200 mBar mobilisation) and obtained a kon value of 1.04 x10⁸ M-1s-1 with >20% error. The fitted curve at this reaction condition is illustrated in figure S1 and shows the mass transport limitation when the capmix times are long enough to facilitate equilibrium condition. At this stage, the kinetics measurements are not possible.
NOTE: The mobilisation pressure must be optimised for different systems. 600 mBar was sufficient to assess the kinetics of current system described in this tech note but the conditions may vary between systems. The main criteria for running a kinetics measurement on Fida Neo is that the pressure condition must meet the limits of Taylor’s dispersion. If the complex formed is too big for the chosen pressure condition, there will be incomplete sample diffusion during measurement. An inbuilt software simulation enables quick assessment of dispersion limits, assisting in setting proper experimental (pressure) conditions.
For cases where complex sizes are too large for fast in-capillary mixing, alternative thinner and shorter capillaries will enable high measurement pressure (hence faster mixing), still meeting the ideal Taylor’s criteria.
To validate the measured parameters on Fida Neo, we performed the kinetics analysis of the same system using Surface Plasmon Resonance (SPR). Table 2 shows the comparison values from the two methods, where with FIDA we observe an affinity of 0.3 nM and with SPR we observe an affinity of 0.24 nM, agreeing strongly. The kon extracted using FIDA was 2.6x10⁶ M-1s-1 whereas the kon using the SPR system was 4.7x10⁵ M-1s-1, which is approximately a factor 3 different. Lastly, using the FIDA to calculate the koff based on the affinity and kon we get a calculated koff of 0.0008 s-1 compared to the 0.0001 s-1 from SPR, which is a factor 8 in difference.
Overall, kon and koff parameters obtained with multiple different mobilisation conditions using Fida Neo are in good agreement with those obtained from SPR. Thus, the Fida Neo platform offers reliable orthogonal way of measuring kinetics parameters without the need of surface immobilisation, in any kind of matrix or buffer systems.

CONCLUSION
In this tech note we have presented the application of Fida Neo instrument to obtain kinetics parameters using an immobilisation free assay setup. The Fida Neo kinetics module was tested using a fluorescently labelled anti-IgG affibody binding to rituximab with high affinity (0.3 nM). By controlling the mobilisation pressure, and thus the reaction times in capillary mixing mode, the setup enables measurement of off-equilibrium affinity, which reflects on the kinetics of the system. We extracted a kon of 2.6x10⁶ M-1s-1 and a koff of 0.0008 s-1, which was consistent over different mobilisation conditions, showcasing the reproducibility of the system. Furthermore, the interaction parameters of the affibody and rituximab system were validated using SPR, where the kinetics and affinity are in good agreement with the results obtained from Fida Neo.