
Assessment of Sample Quality with every measurement. FIDA Fundamentals.
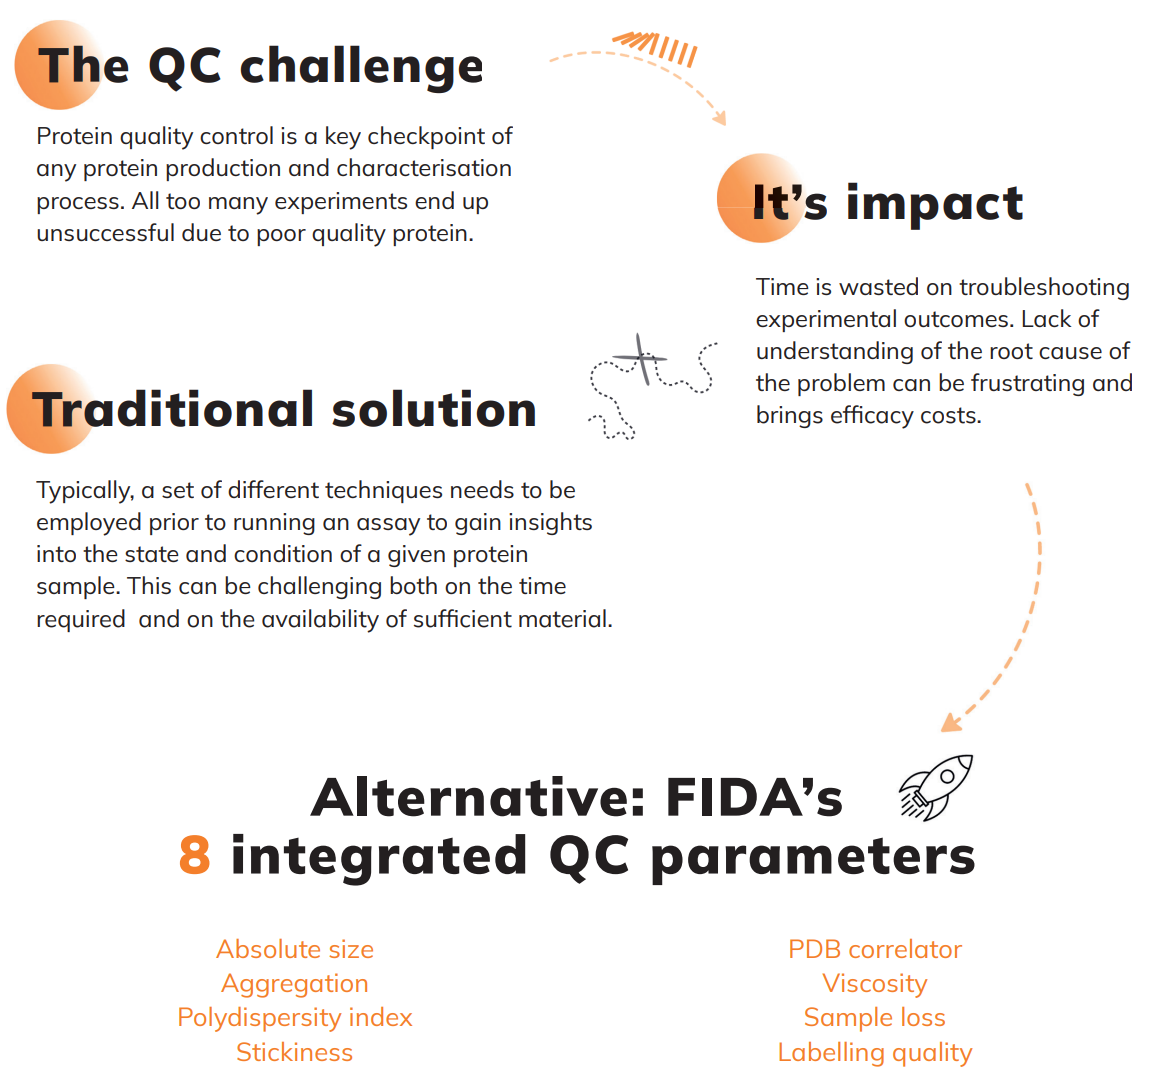
Fida Neo measures the quality of your sample in one single assay, disentangling the compounding effect of biophysical parameters to provide reliable quality control.
It can measure the absolute in-solution size of your molecule in nanometers, quantifying sample aggregation and viscosity, identifying sample stickiness, defi ning the heterogeneity of a sample via the polydispersity index, and identifying free versus conjugated fl uorophores in labelled samples.
This detailed insight into the individual biophysical parameters of your sample makes Fida Neo the fastest platform for developing new assays. In addition, it fundamentally accelerates your research due to the ease of understanding the behaviour of your molecules.
INTRODUCTION
Protein quality control is the most crucial checkpoint of any protein production and characterisation process. All too many experiments end up unsuccessfully due to poor quality protein. Not only do you risk that useful data is not generated, but significant amounts of time can be lost on troubleshooting assay design without reliable insight to the protein itself. It is therefore highly valuable to have in-depth confirmation that the protein you work with behaves as in its native state. Typically, a set of different techniques needs to be employed prior to running an assay to gain insights into the state and condition of a given protein sample. The Fida Neo instrument offers great advantage for deciphering a wide array of quality control (QC) parameters. With Fida Neo, these parameters do not have to be measured in a separate assay in advance of your experiments but are integrated in every measurement you perform. Combining these QC parameters with Fida Neo assays being tolerant to any type of buffer composition and consuming only nanolitre (nL) sample volume, is resulting in an assay robustness that cannot be achieved with any other technology.
The following describes the fundamentals of Fida Neo methodology and data interpretation:
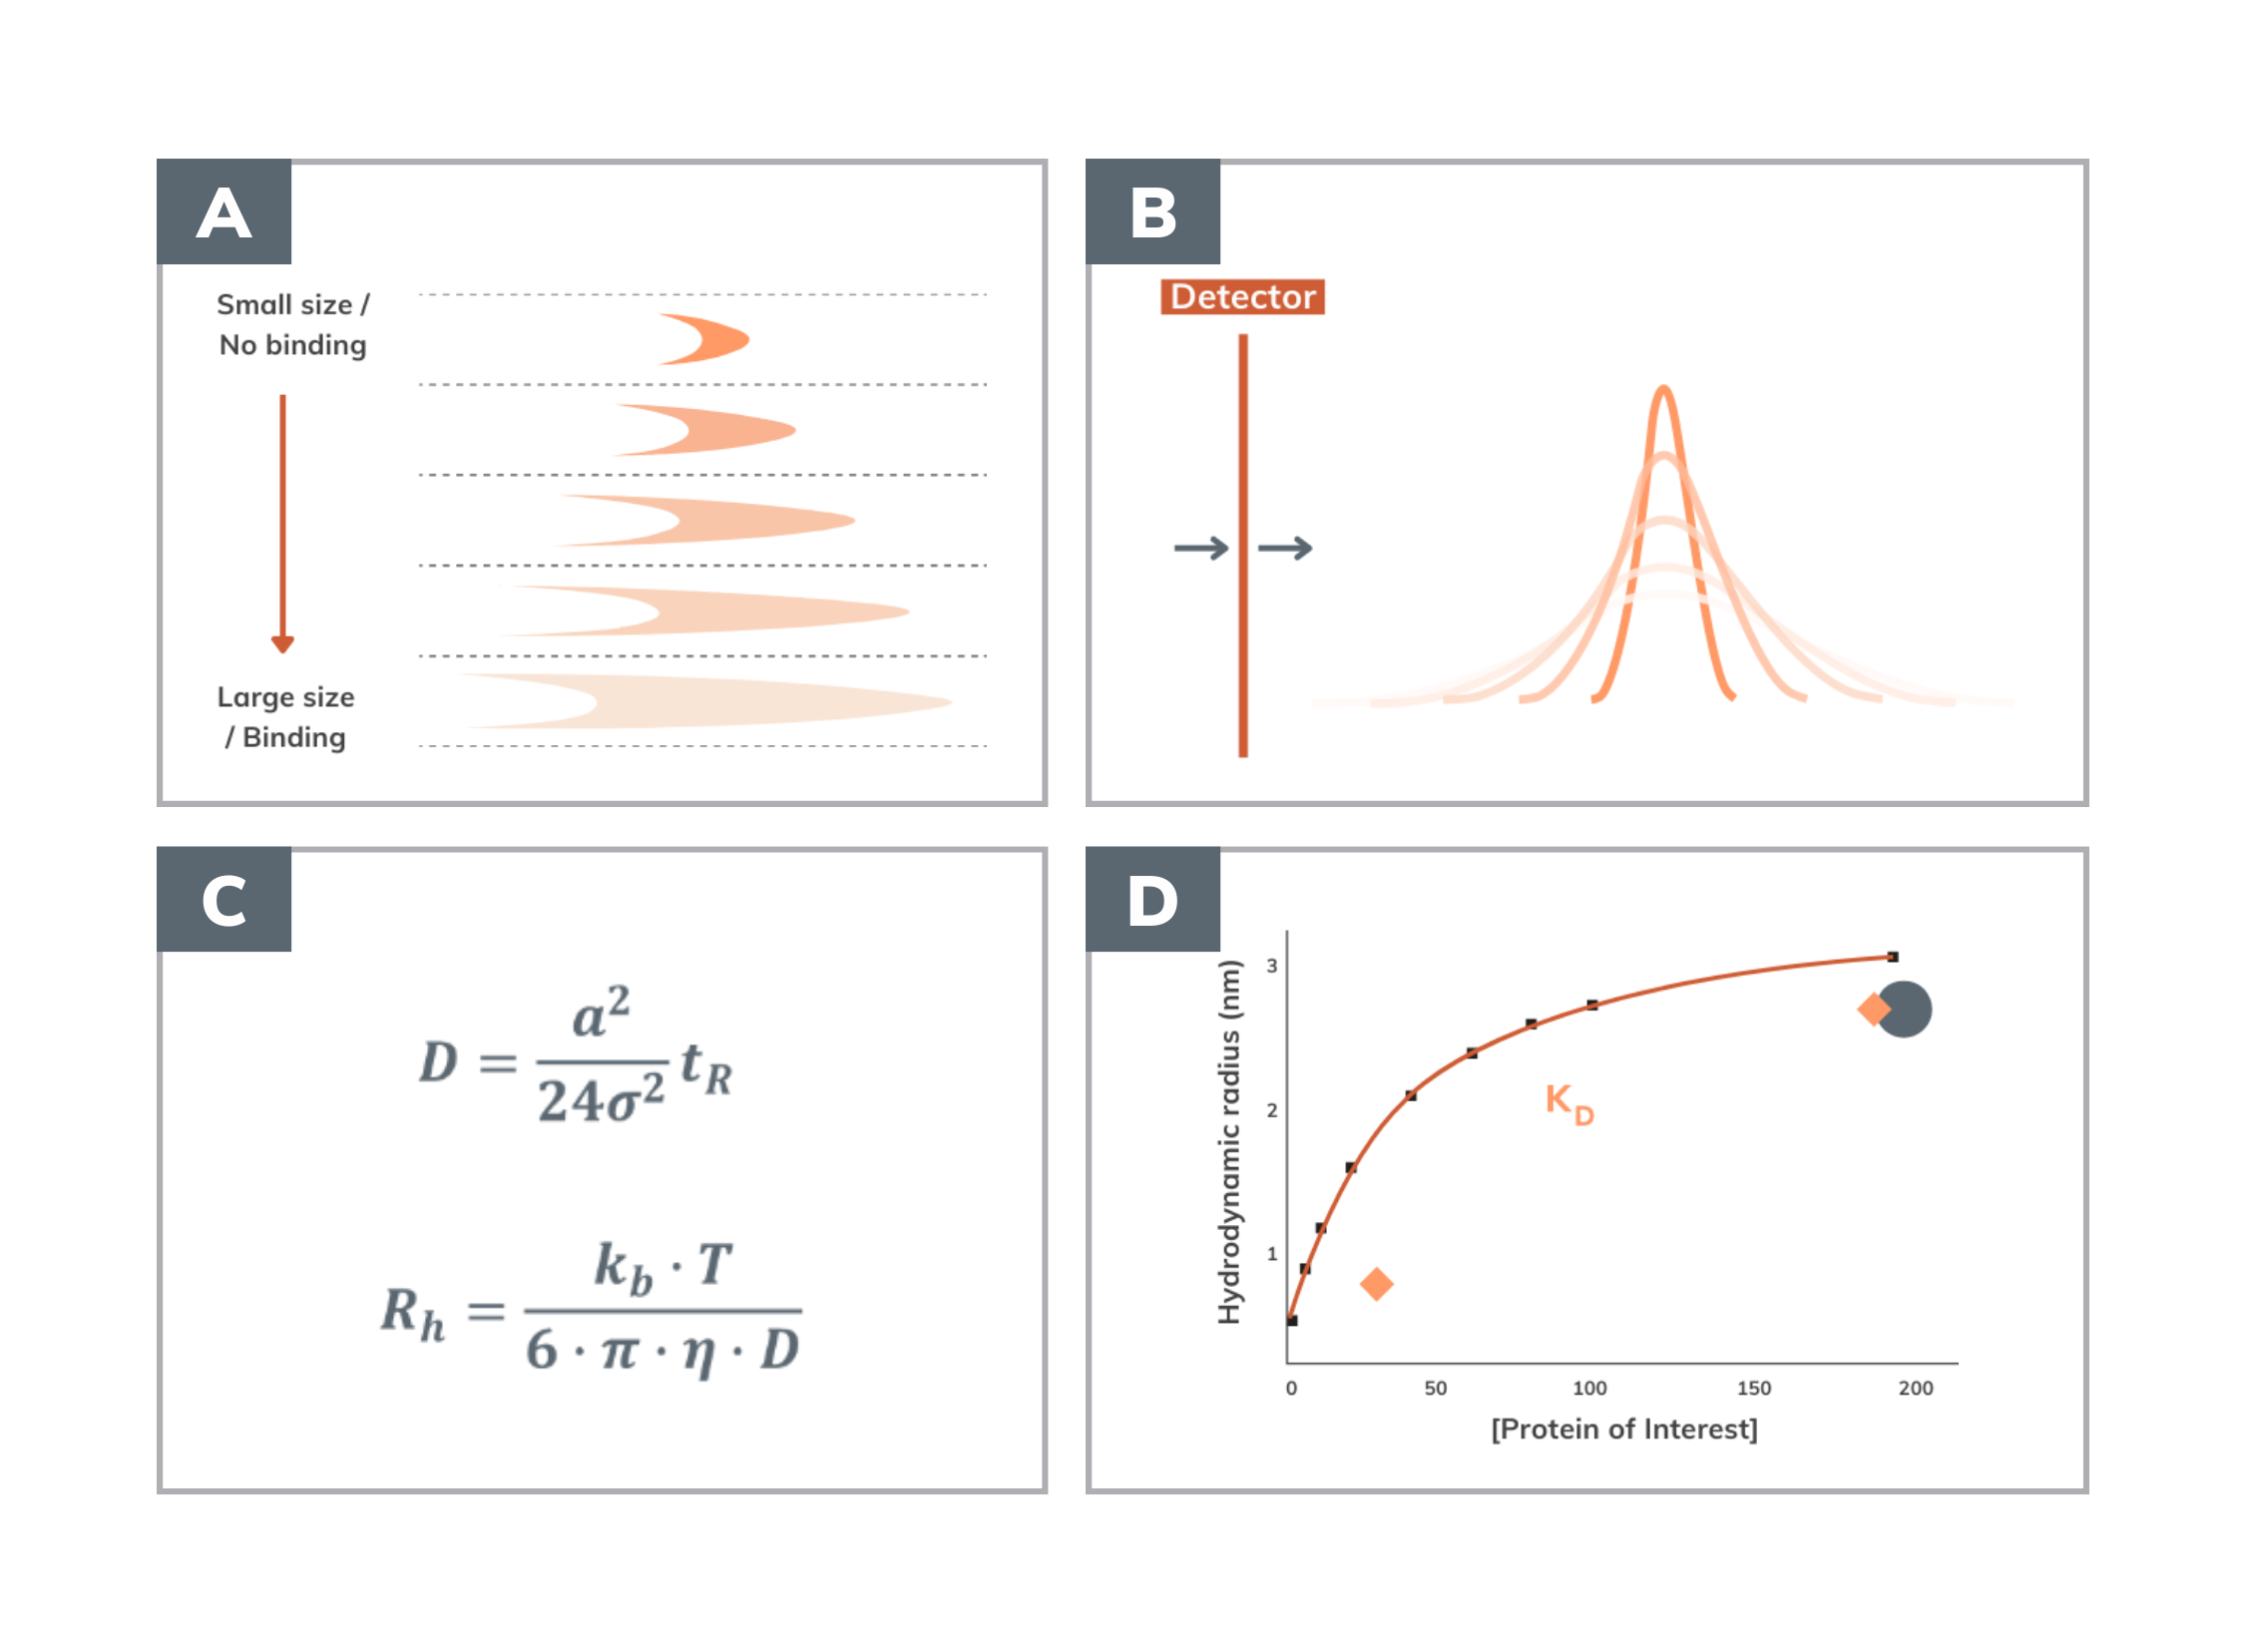
A: Dispersion profi les occurring in capillary. The shape of the profi le depends on the size of the fl uorescent molecule or on the size of the complexes it forms with its binding partners.
B: Corresponding detector readout.
C-D: Calculation of diffusivity, D, and hydrodynamic radius, Rh, is used to measure the affi nity, KD, of binding partners.
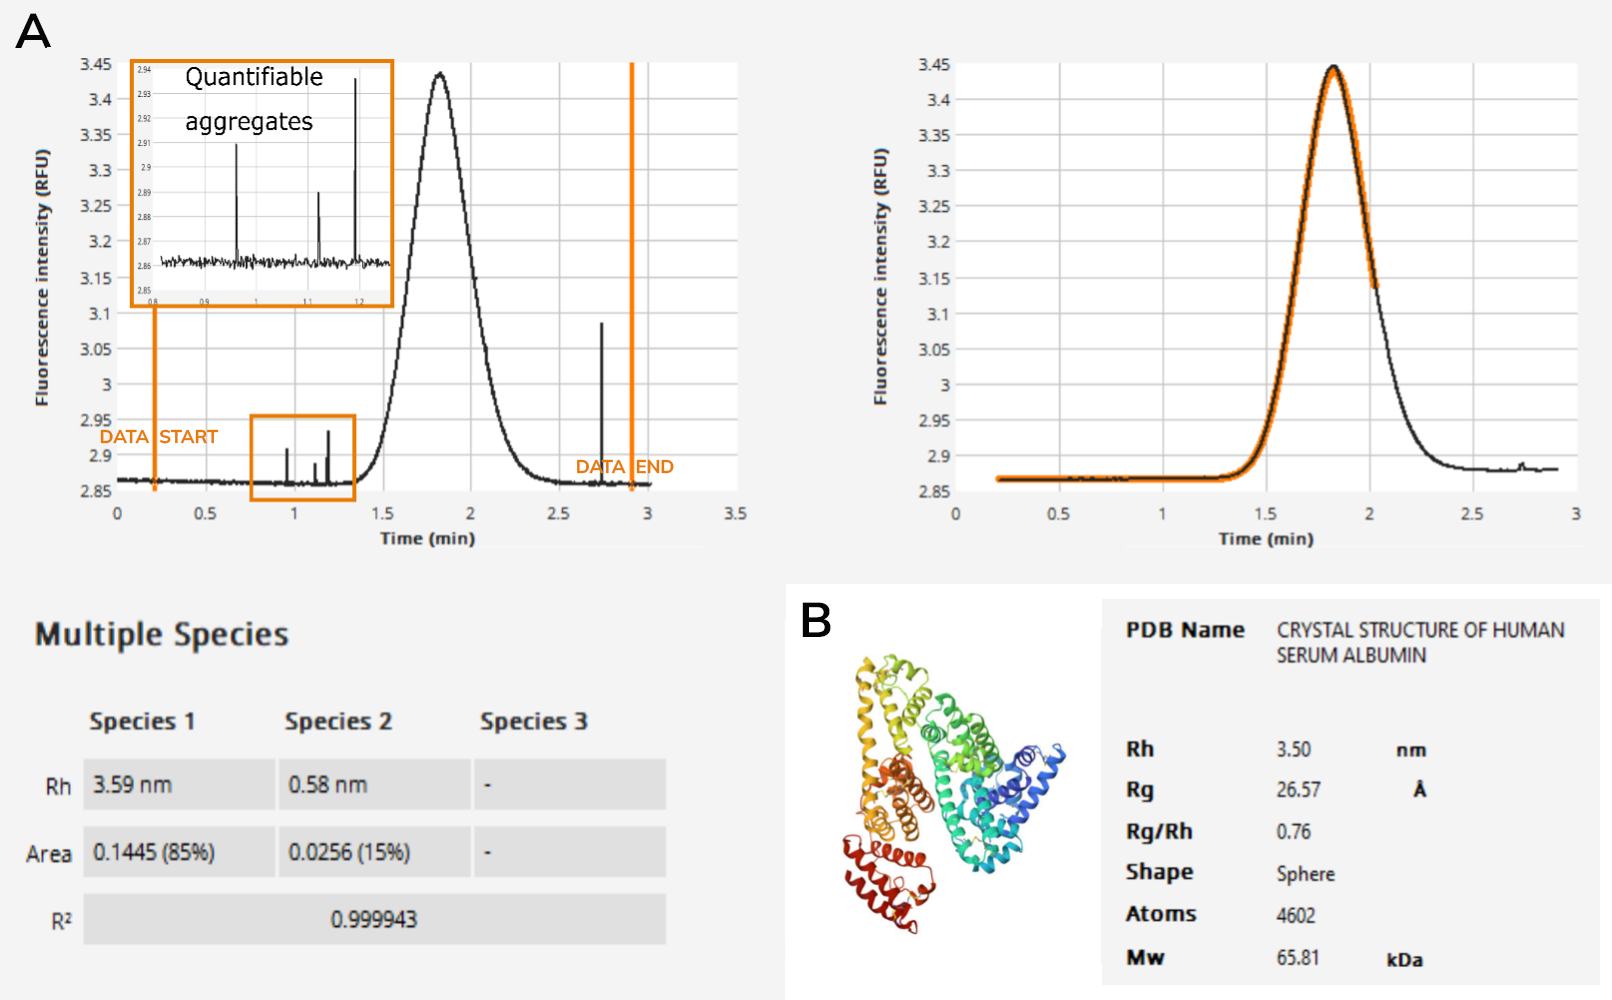
A: Aggregation signal is obtained and quantifi ed as spikes (shown in magnifi ed inset), sample species and size determination are performed for the gaussian signal, fractions of multi species (presence of free fl uorophore in this case) is provided as percentage.
B: Rh (3.50 nm) prediction performed using PDB code for human serum albumin is comparable with the measured Rh (3.59 nm) of the sample, indicating a stable/native state of the protein.
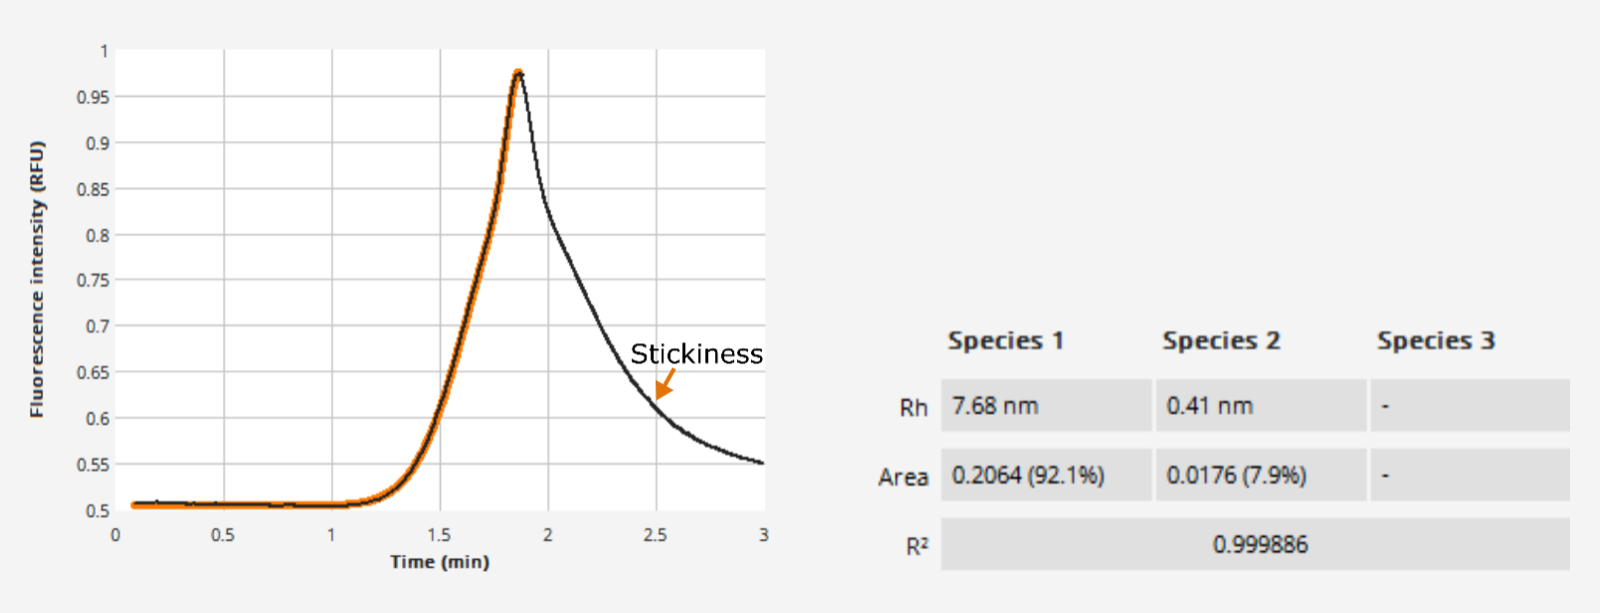
Sample stickiness is clearly visible as tailing of the raw gaussian signal in an uncoated capillary condition.
Sample stickiness is resolved by running the same sample on a dynamically coated capillary (Fida Biosystems).
MATERIAL & METHODS
Experiments were performed on a Fida Neo instrument employing 280 nm and 480 nm LEDfluorescence detection using a standard capillary (from Fidabio). Each data point consumed only 39 nL of protein sample with an analysis time of 5 min. Data analysis was conducted utilising the Fida Software (Version 3.0).
RESULTS
Fida Neo delivers a range of biophysical parameters from a single assay format. This includes direct assessment of protein’s state by means of absolute hydrodynamic radius (Rh) measurement, along with supplementary features reflecting the sample quality. With every Fida Neo measurement, clear indications for sample loss, aggregation, viscosity, stickiness, polydispersity and labelling quality (or multi-species) are obtained. Unlike other technologies where such sample attributes will challenge assay design and obscure data interpretation, Fida neo highlights sample issues and thereby provides users with the opportunity to strategically resolve them.
Absolute size as firm reference for protein state (PDB correlator)
In biophysical studies, detection of molecular size is a strong, quantitative source of information about the overall structure of a protein and its complexes. Fida Neo enables determination of absolute in-solution size of molecules, using only nanolitre amount of sample (figure 2A). Surprisingly often, the in-solution behaviour of a protein is e.g., not monomeric, and Fida Neo’s readout in nanometres provides a straight-forward evaluation. To establish a strong and reliable reference, Fidabio PDB correlator (figure 2B) also enables prediction of hydrodynamic radius (Rh) from either experimental structure (available in protein data bank) or simulated ones (created by using Pymol or AlphaFold).
Indication of sample aggregation
Characterisation of protein aggregation is key to successful biopharmaceutical development and manufacturing. Aggregation can occur at any stage of development or manufacturing process including purification, bioprocessing, formulation, packaging or even during storage. Quantification of in-solution sample aggregation is performed ubiquitously, all throughout Fida Neo measurement. Sample molecules that form large aggregates (big soluble/insoluble particles) often cause high light scattering and are detected as distinct spikes on the raw FIDA signal. This is illustrated in figure 2A. These sample aggregates can be discretely quantified using the ‘spike counter tool’ integrated in Fida analysis software. When required, walk-away buffer screening to minimise aggregation is easily performed applying the Fida Neo’s built-in autosampler.
Clear indication of sample stickiness
Non-functional interaction of proteins with the assay apparatus is a common challenge for several biophysical techniques. Many times, sample stickiness goes unnoticed and causes difficulties in assay optimisation and data interpretation. Every measurement performed using Fida Neo provides information on sample stickiness making users fully aware and hence enabling strategic solutions (like surface coating). As an outcome of radial diffusion of the sample during FIDA measurement, the acquired gaussian distribution of the sample molecules is fitted with a gaussian function during analysis. In cases where the sample sticks to the walls of the Fida capillary, a clearly visible tailing effect can be observed as illustrated on the signal shown in figure 3. In the Fidabio data analysis method, mild stickiness of the sample is tolerated without affecting the size readout. However, for stronger stickiness scenarios, Fidabio offers coating strategies like reversible and permanent surface coating, to counteract sample stickiness/adsorption.
Sample polydispersity
Polydispersity index (PDI) is a critical quality control parameter for particle characterisation or post-purification protein characterisation, that defines the heterogeneity of a sample based on size distribution. Fida software integrated with the “PDI calculator” analyses the raw FIDA signal for sample dispersity information. Sample PDI values >0.05 indicates polydispersion.
Absolute viscosity measurement with every measurement
Based on the Stokes-Einstein law (Eq.1), viscosity (η) of a solution significantly affects the hydrodynamic radius measurements and can lead to over/under estimation of the molecular size, if not considered.
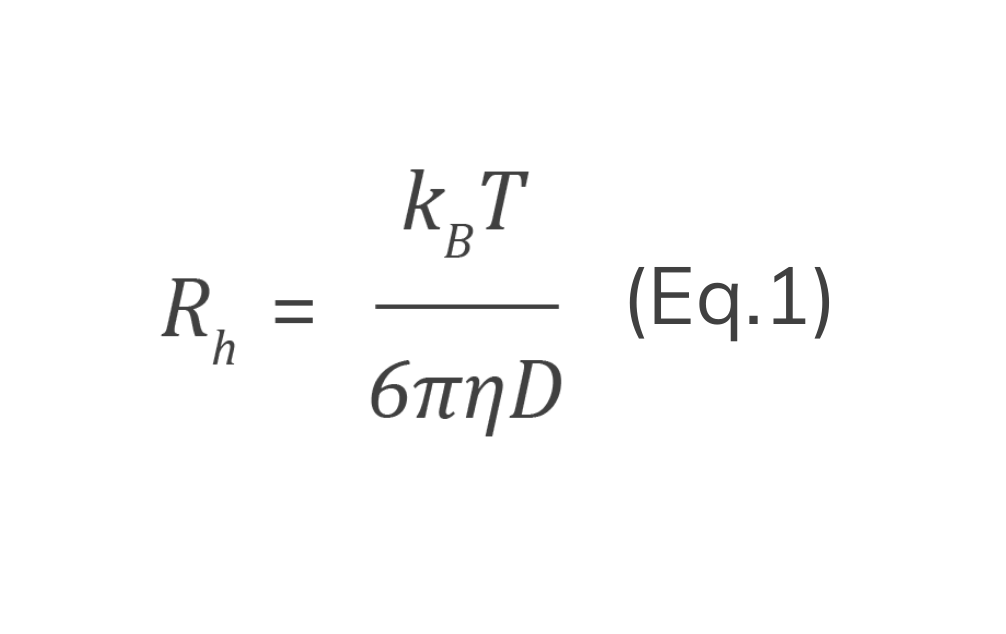
Written out, the Stokes-Einstein relationship is D = kBT / (6πηRh), or rearranged for size, Rh = kBT / (6πηD). In plain characters: Rh = kB T / (6 pi eta D). Here D is the diffusion coefficient in square metres per second, kB the Boltzmann coefficient (1.380649 x 10⁻²³ joules per kelvin), T the absolute temperature in kelvin, η the sample viscosity in pascal seconds, and Rh the hydrodynamic radius in metres. Every term is set out in Stokes-Einstein equation: symbols and SI units.
Since FIDA is a capillary flow-based technology, fluctuations in sample viscosity, which may arise due to high protein concentration or temperature are sensitively detected as variation in sample residence time (tR). In FIDA measurements, given that the capillary diameter and temperature are kept constant through the measurement, tR only depends on viscosity of the sample. Hence, contrary to most biophysical technologies, FIDA accounts for absolute sample viscosity in Rh calculations for every data point and offers auto compensation for possible variations in Rh.
Labelling efficiency
Standard fluorescence-based assays often fail to detect the presence of unreacted (or free) fluorophore in a fluorescently labelled sample. The presence of free fluorophore will lead to inaccurate results and loss of sensitivity. FIDA experiments enables efficient detection of free fluorophore in a sample and provides explicit fractions of free versus conjugated fluorophore. Since the technology works on the basic principle of molecular diffusion, species of different sizes (i.e., different diffusivity) can be detected by simple analysis of raw signal using the Fida analysis software. Every FIDA measurement involves a peak area readout, which is proportional to the intensity of fluorescence. The automatic peak area analysis in the software is used to calculate fractions of free and conjugated fluorophore in a sample (figure 2A). Experimental analysis on such a sample (or similar sample with multi-species) can be performed by interpreting only the signal arising from labelled protein, resulting in more accurate results.
QC Dashboard
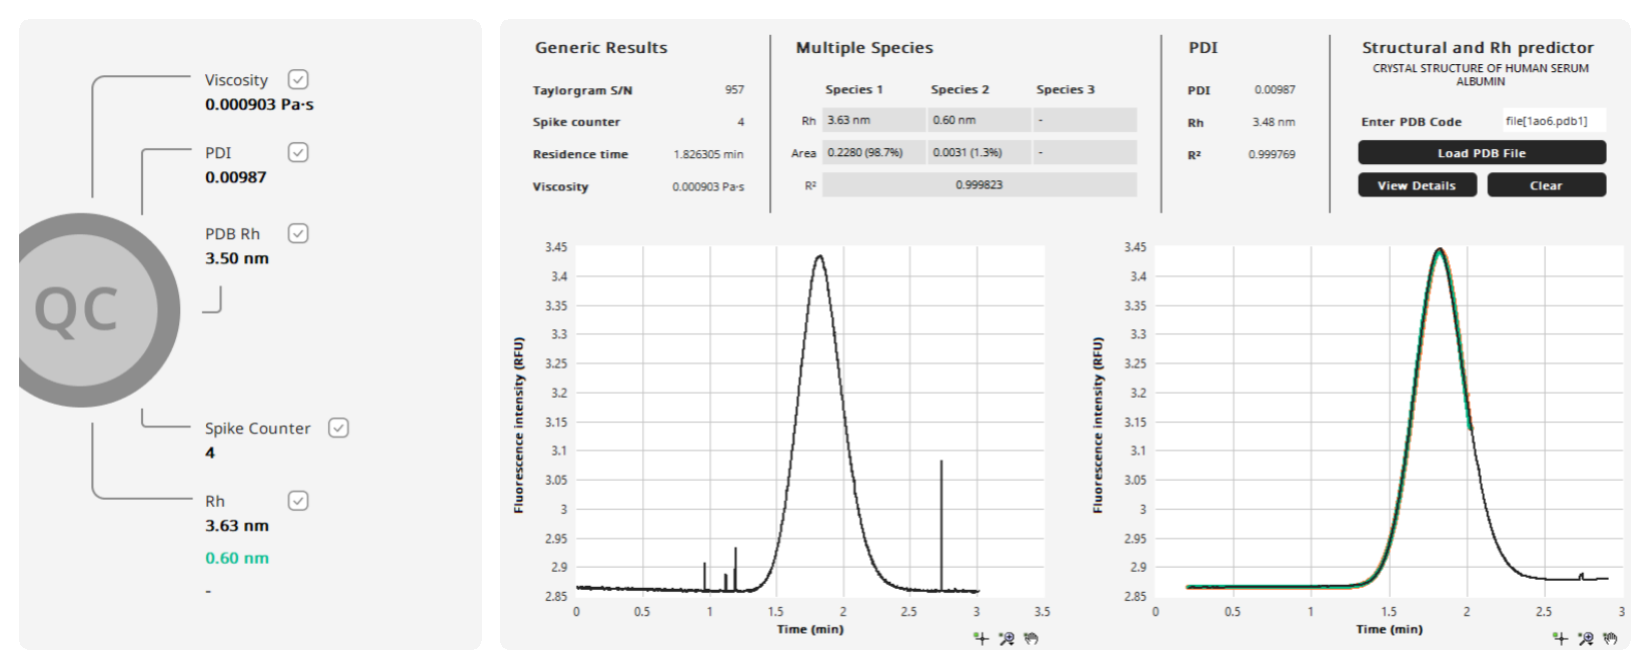
The Fida software enables easy visualisation and export of sample QC data using an in-built QC dashboard. Illustrated in figure 4, the QC dashboard compiles different quality parameters (on figure 4, left panel) for easy visualisation and analysis. Users can customise and configure reports to export them as .pdf, .txt or .csv files.
REFERENCES
1. Pedersen, ME; Gad, SI; Østergaard, J; Jensen, H. Protein Characterization in 3D: Size, Folding and Functional Assessment in a Unified Approach. Anal. Chem., 2019, 91 (8), 4975-4579.
2. Pedersen, ME; Haegebaert, RMS; Østergaard, J; Jensen, H. Size-Based Characterization of Adalimumab and TNF-α Interactions Using Flow Induced Dispersion Analysis: Assessment of Avidity-Stabilized Multiple Bound Species. Sci. Rep., 2021, 11 (1), 1-10. accurate results.