
Characterizing Multivalent Complex Formation
INTRODUCTION
Multivalent interactions are of great importance in cellular regulation and immune response. However, the ability of multivalent molecules to form agglutination prone hetero-oligomeric networks makes it difficult to decouple the agglutination process from the direct interaction, which can skew the measured affinity and biophysical properties of the system. This makes it very challenging, if not impossible to study, these kinds of interactions using most biophysical techniques.
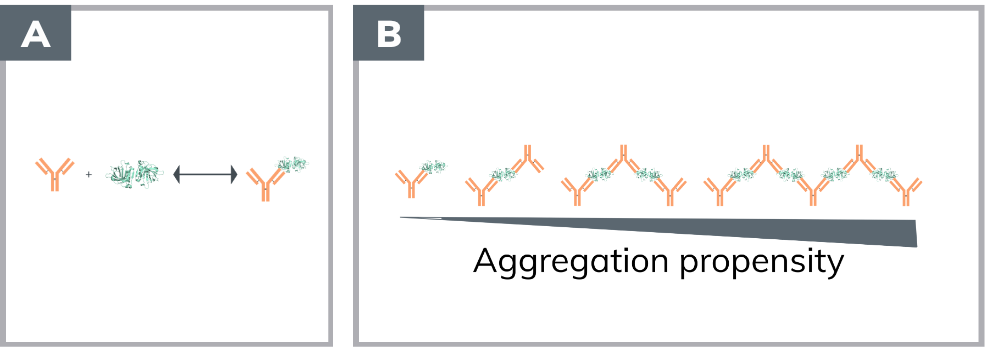
In this appnote we’ll demonstrate how the Fida 1 can be used to probe the initial interaction as well as the impact of agglutination between bovine β-lactoglobulin (BLG) and a anti BLG rabbit IgG (Figure 1) by using flow induced dispersion analysis with capillary mix. This is achieved by keeping the labelled protein of interest separate from the analyte in the sample holder and only mixing them in the capillary (Figure 2) during the actual measurement. The adjustable mobilization pressure then allows for control of the complex lifetime before detection allowing for quantification of interaction, aggregation, soluble agglutination, complex size and Kd.
.png)
Material & Methods
Fidalyzer equipped with a 480 nm LED fluorescence detector. A Fida coated capillary (L: 1 m, ID: 75 µm, Leff: 84 cm). The buffer used was PBS. Indicator concentration was 26 nM ALC480 labelled BLG.
The analyte concentration was titrated from 0 - 6.3 µM anti BLG rabbit polyclonal IgG (Bethyl, A10-125A). The same samples were measured at 3 different mobilization pressures 100, 400 and 600 mbar corresponding to reaction times of 1.2, 1.8 and 7.7 minutes.
Results
The titration of anti BLG IgG and the dilute ALC480-BLG were prepared in an amount sufficient for all three titrations and the assay was performed as a Capmix at three different pressures. When ALC480-BLG is then measured in the presence and absence of 6.3 µM a clear increase in the hydrodynamic radius (Rh) from 2.09 ± 0.03 nm to 9.23 ± 0.23 nm is observed in the presence of anti BLG IgG indicating, complex formation. This complex size is much bigger than the expected size of the quaternary complex (336 kDa ~ 6.6 nm sphere) suggesting the presence of higher order oligomers which appears to be unstable as aggregation spikes are observed when the complex is formed (Figure 3).
.png)
The complex confirmed a full titration of anti BLG was performed from 0 - 6.3 µM using capmix and a mobilization pressure of 400 mbar. The resulting binding curve was fitted to a one-one binding model (Figure 4). Further evidence of aggregation is observed by plotting the fluorescent area of the samples recorded simultaneously by the Fida 1. A clear decrease in the fluorescence area is observed as a function of IgG concentration. As ALC480 fluorescence is very insensitive to the chemical environment (See Fidabio Technote), this is clear evidence of complex agglutination (Figure 4).
.png)
.png)
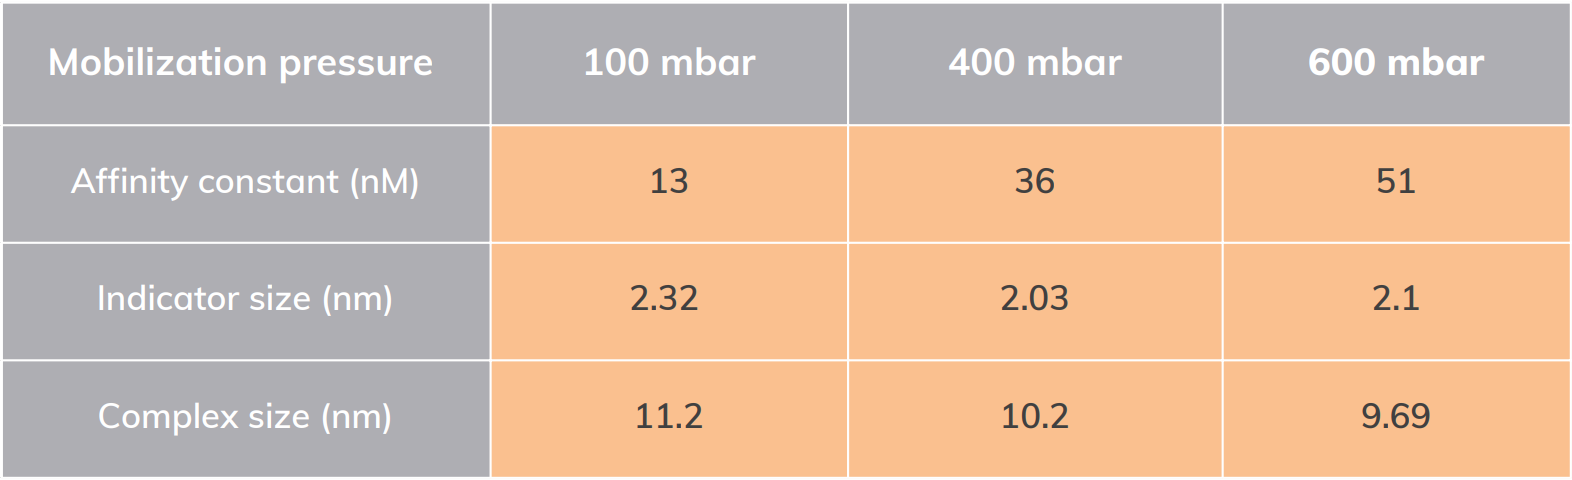
To investigate the impact of the complex lifetime the same samples were measured at three different mobilization pressures 100, 400 and 600 mbar resulting in complex lifetimes of 1.2, 1.8 and 7.7 minutes (Figure 5). The samples recorded at 600 and 400 mbar only varies slightly. However, at 100 mbar the observed sizes are much bigger, indicating more advanced aggregation (Figure 5). This also impacts the fitted Kd which varies up to a factor 4 depending on the mobilization pressure. Naturally, the number of aggregation spikes also increase with higher IgG concentration.
Conclusions
In this app note we have demonstrated the utility of the Fida 1 in investigating large complexes caused by antigen/antibody multivalency.
The capmix approach allows for probing the influence of the aggregation on the complex size and affinity observed and easily measure and characterize complex interactions with minimal sample usage.