FIDA-Driven High-Throughput Screening of Metal Binding Proteins for Synthetic Biology
INTRODUCTION
Driven by advances in machine learning (ML) and artificial intelligence (AI), synthetic biology is revolutionizing development of de novo proteins with new properties for biotech and biomaterials industries. Key to success is the ability to rapidly screen binding properties and feed it into ML models. Metals are essential cofactors of proteins to facilitate enzymatic reactions, carry out transport, ensure structural integrity or perform regulatory tasks, such as signal transduction. Assaying, deciphering and understanding protein-metal interactions help to unlock novel therapeutic targets, enhance or change enzymatic function but also create novel protein-based biomaterials [1]. Protein-based biomaterials are continuously rising, thanks to tools developed by the synthetic biology community allowing to easily design, build and test thousands of protein variants [2]. Consequently, state of the art technologies such as isothermal calorimetry titration or fluorescence quenching becomes a bottleneck in throughput or sample consumption required to perform those assays.
Flow Induced Dispersion Analysis (FIDA), has emerged as a new solution thanks to low protein and sample consumption, sensitive signal detection and sample throughput, creating the ideal solution to screen and characterize metal binding proteins. Metal binding proteins often undergo a confirmational change upon binding of a metal ion. The conformational change can be large, for example with Lanmodulin [3] where substantial rearrangements in the protein occurs upon binding of up to three lanthanide ions. In other systems metal binding results in small rearrangements of the protein backbone, for example the super uranyl-binding protein [4]. FIDA has three readouts to measure a metal binding interaction independent of its magnitude: hydrodynamic radius, a change in fluorescence intensity or a change in the fluorescence ratio (Lambda Dynamics [LD]).
Logically, we employ FIDA in two workflows. The first one is to screen various metal binding proteins in their ability to bind metal ions. In the other workflow we rely on FIDA as a readout for metal binding affinity libraries of one metal binding protein.
material and methods
Proteins were cloned from linear DNA fragments into an expression vector in a 96-well plate format via modular cloning. Then, the GoldenGate reaction was used to transform E. coli BL21(DE3) cells. After transformation cells were incubated for 1 hr at 37°C with 100 ul SOC medium. The whole recovered cell mixture was used to inoculate 0.9 ml LB-Kanamycin media in a 96-deepwell plate. The cells were allowed to grow overnight at 32°C, 1200 rpm in a deepwell plate shaker. Next day, 5-10 ul were used to inoculate 1 ml expression media and again shaken for 24 hrs at 32°C, 1200 rpm with the deepwell plate shaker.
In the morning of the 3rd day, cells were harvested by centrifugation at 15 Mins, 4000 rcf. Remaining media was decanted, and the plate was knocked dry with filter paper. Cell pellets were lysed with chemical lysis buffer (NZYtech, NZY Bacterial Cell Lysis Buffer) for 1 hr at 25°C, 1200 rpm. Another round of centrifugation (15 Mins, 4000 rcf) sedimented the insoluble fragments from the soluble ones. Then, 200 ul of the clarified cell lysate was transferred to another plate and the protein of interest was extracted from the lysate.
Fida Neo equipped with a 280 nm fluorescence detector and was used with the permanently coated (PC) capillary (L: 1 m, ID: 75 um, L 84 cm). The capillary chamber was heated to 25°C.
The instrument was used in capillary mixing mode with the following protocol for each injection:
- 3500 Bar, 20 secs, 0.2 % Acetic Acid
- 3500 Bar, 25 Secs, MilliQ
- 3500 Bar, 20 secs, Analyte Capillary Filling (Buffer with or without metal)
- 50 Bar, 10 Secs, Inject Indicator (BSA or MQ)
- 800 Bar, 90 Secs, Mobilize and Measure (Buffer with or without metal)
Every 10-20 injections, a washing step, an injection with BSA and an injection with MilliQ water was performed to ensure homogenous operation conditions and detect potential clogging of the capillary early on (compare Figure S1). All measurements were performed in triplicates.
results
Metal Binding Proteins
Figure 1 showcases the workflow of our established screening pipeline. Upon receival of the DNA fragments, the measurement can be started within 3 days. If work is started on a Monday, then the titration experiment to determine the binding constants can be started on a Friday and the measurement is ready for analysis on the Monday after. Depending on the starting point the turnaround time from gene to protein analytics within 7 days is possible.
.png)
In a first approach we wanted to evaluate to what extend metal binding proteins can be evaluated with FIDA. Figure 2 shows the periodic table of elements with the metals highlighted where we ordered DNA sequences for known protein-metal interactions.
.png)
Overall, 34 metal binding proteins were tested. A signal change of 5 % in fluorescence area or fluorescence ratio as well as a size difference bigger than 0.1 nm (1 Å) was enough to call the protein as “interacting with the metal ion”. Only one out of the three signals had to change. Out of 34 tested proteins, 26 showed binding (24 size changes, 26 fluorescence area changes, 24 fluorescence ratio changes), 7 did not show binding and for 1 it was inconclusive. Figure 3 highlights the results from the screening approach and the various metals. From the 26 proteins, 4 were selected and a metal concentration titration assay was performed with the same batch of proteins.
.png)
Figure 4 shows the outcome of the titration experiment, four selected proteins from the screening pipeline were subjected to a range of concentrations of their corresponding metal ion. Overall, it was possible to clone, express, purify the proteins, screen the metal binding library and determine their binding constant within one week.
.png)
Magnesium Affinity-Library Screening
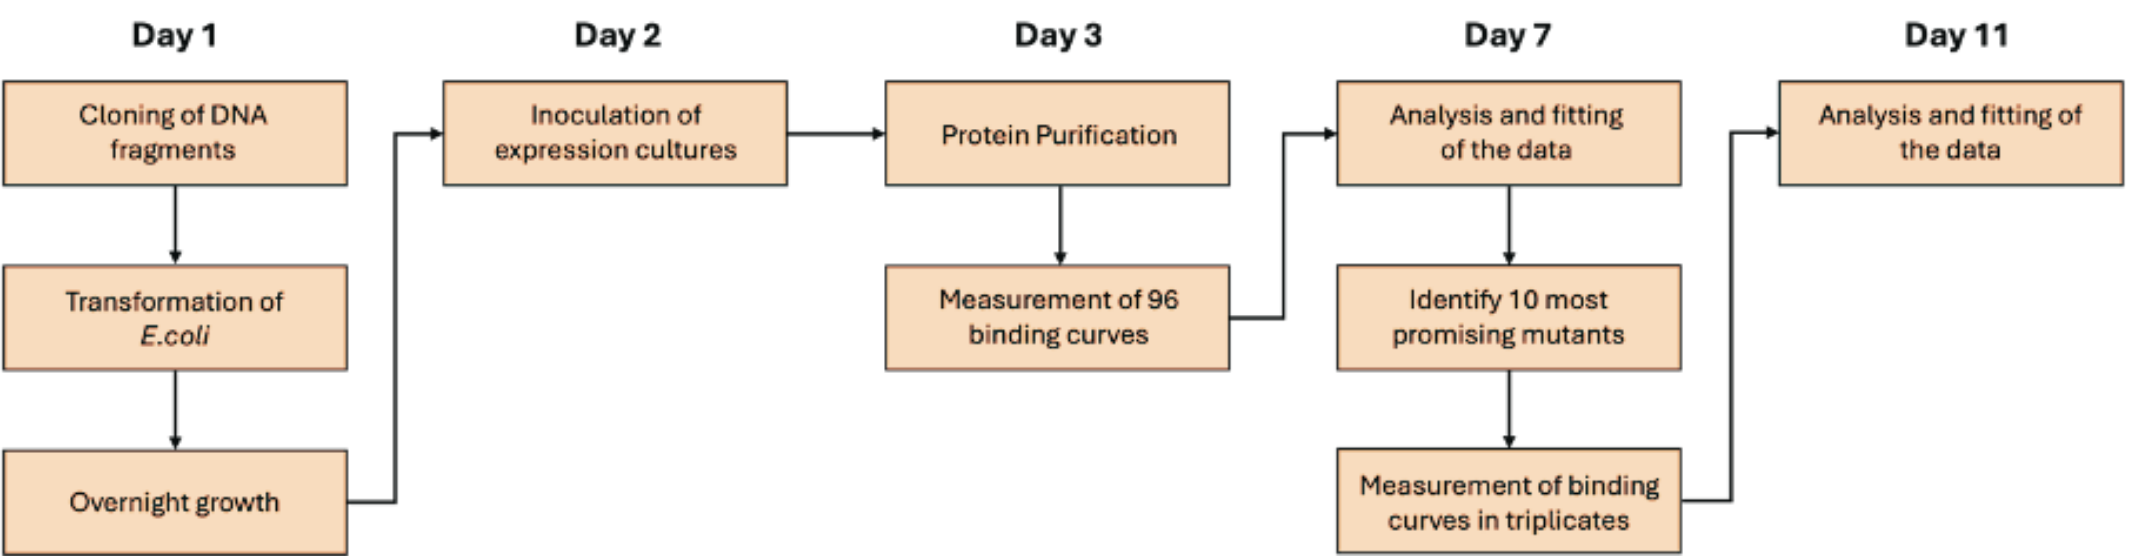
Figure 5 illustrates the workflow used to screen 95 mutants for increased affinity to Mg compared to the wildtype (WT) protein, with the FIDA neo instrument. Starting from DNA fragments, cloning and transformation was completed within day 1. On day 2, small-scale expression was performed for 24h. Once protein purification was finished within the morning of day 3, the first set of measurements was started. Each of the 94 mutant proteins and the WT was recorded in presence of 11 different Mg concentrations and without Mg, in single measurements, resulting in a total of 1140 runs. Total instrument run time for this set of measurements added up to around 4 days. On day 7 analysis was started. First, samples were checked for their size and for mono- or polydisperse state. Proteins that tend to oligomerize often contain a mixture of species of different sizes, representing the monomer and multiples of the protein.
When the Taylorgram is fitted using a multi-species model, the relative abundance of each form is calculated from the relative area under its corresponding fitted peak. Samples with insufficient signal and polydisperse samples with more than 40% of protein in an oligomeric state, were excluded from further analysis. Next, affinity for Mg of each protein was assessed by fitting binding curves to data from all three channels (hydrodynamic radius, fluorescence area and fluorescence ratio). Not all three readouts worked equally well for all mutants tested. Overall, fluorescent ratio showed to be the most robust and suitable parameter for this type of protein and could be used to determine Kd values for around 90% of the proteins analyzed. Ten mutants showing the most promising results in the first set of measurements were identified to be measured in triplicates, starting on day 9. The final analysis of the top ten mutants with increased affinity for Mg was performed on day 11.
In our screen for increased Mg binding affinity, in total 50 mutants performed better than WT. Performance of all proteins, that could be analyzed by fitting fluorescent ratio data is shown in figure 6. Values exceeding the horizontal line, which marks the WT-value, represent mutants with improved binding affinity.
.png)
Figure 7 depicts representative Mg-binding curves of three improved mutants compared to WT. The mutants exhibit more than 30-fold lower Kd than the WT, showcasing the successful identification and characterization of improved variants with FIDA technology.
.png)
Next to comparing affinities of different mutants for Mg, we also used FIDA technology to compare affinities of selected mutants for different metals to further characterize the protein and gain insights into selectivity. Figure 8 illustrates the binding behavior of mutant 49 towards Mn, Ca and Mg.
.png)
Conclusion
The Fida Neo instrument is capable of screening and verifying protein-metal interactions at the nM to mM-range. Moreover, FIDA was suitable to identify and characterize variants with increased affinity but also helped to exclude variants with undesirable properties such as propensity for oligomerization. Thanks to the low sample consumption and the capability of using 96-well plates both can be done with the same batch within one week and thus accelerates the design, build and test cycle to empower synthetic biology in automated workflows.
references
[1] Permyakov EA. Metal Binding Proteins. Encyclopedia. 2021; 1(1):261-292. https://doi.org/10.3390/encyclopedia1010024
[2] Vegh, P., Chapman, E., Gilmour, C., Fragkoudis, R. (2025). Modular DNA Construct Design for High-Throughput Golden Gate Assembly. In: Schindler, D. (eds) Golden Gate Cloning. Methods in Molecular Biology, vol 2850. Humana, New York, NY. https://doi.org/10.1007/978-1-0716-4220-7_4
[3] Cotruvo Jr., J. A., Featherston, E. R., Mattocks, J. A., Ho, J. V., Laremore, T. N. (2018) J. Am. Chem. Soc., 140, 44, 15056–15061
[4] Zhou, L., Bosscher, M., Zhang, C. et al. A protein engineered to bind uranyl selectively and with femtomolar affinity. Nature Chem 6, 236–241 (2014). https://doi.org/10.1038/nchem.1856
[5] Wikipedia. Periodic Table: Colour 18-col PT with Labels,
https://en.wikipedia.org/wiki/Periodic_table#/media/File:Colour_18-col_PT_with_labels.png., Accessed 23 July 2025. Licensed under CC BY-SA 4.0.
supporting figures
.png)
B) Overlay of taylorgrams of all MilliQ water injections over the course of one experiment (in black) compared to a BSA injection (blue). The water controls check for a stable baseline throughout the experiment.
.png)
This project is funded by the FFG (www.ffg.at). The FFG is the central national funding agency and strengthens Austria’s innovative capacity.