FIDA in a clinical setting: Determination of shifting sphingosine 1-phosphate (S1P) binding to its carrier molecules serum albumin (SA) and high-density lipoprotein (HDL)
Introduction
Sphingosine 1-phosphate (S1P) is the smallest sphingo-phospholipid metabolite and ligand of five different G protein-coupled S1P receptors designated S1PR1-5. It is produced by two intracellular sphingosine kinases (SphK1/2) and irreversibly cleaved into hexadecenal and phosphoethanolamine by the S1P lyase (SGPL1) (ref 2). S1P is stored in red blood cells (RBC) and released into plasma, where it binds mainly to serum albumin (SA) and high-density lipoprotein (HDL) as its main carrier molecules in circulation (ref 1). In HDL, it is mainly bound to apolipoprotein M (apoM) and responsible for many of the positive effects of HDL including endothelial cell barrier formation (ref). Different cell signaling responses were reported for HDL-bound S1P and SA-bound S1P, indicating that the use of specific carriers could influence S1P-driven cellular responses (ref). Thus, a shift of S1P-binding carrier molecules could be indicative for certain pathological conditions, and normalization of S1P-carrier binding might be a new therapeutic option to normalize cell signaling responses in vivo (ref).
Flow Induced Dispersion Analysis (FIDA) is a capillary-based technique used to quantify biomolecular interactions by measuring complex formation and determining binding affinities under native conditions (ref 4). Owing to its strong compatibility with complex biological matrices, including clinical samples (ref 3), FIDA represents a well-suited approach for studies requiring analysis in physiologically relevant environments, making it an ideal choice for the work presented here. The present application used fluorescein labelled S1P (S1P-FITC) as an indicator to monitor complex formation with SA and HDL in plasma and serum samples . Due to the vast differences between SA and HDL regarding reported binding affinities of S1P (21 nM – 0.9 µM for HDL and 1.3 µM - 22 µM for SA) and physiological concentrations in serum and plasma (500 - 750 µM SA and ≈ 1µM apoM), capillary mix method and complex dissociation method were used to discriminate between S1P-FITC binding to SA and HDL, respectively.
Material & Methods
The experiments were performed with the Fida 1 instrument using 480 nm LED-induced fluorescence detection with Fida standard capillaries (i.d.: 75 µm, LT: 100 cm, Leff: 84 cm).
Sample analysis was done for determination of SA-S1P complexes with the capillary mix method (CapMix) using 50 nM S1P-FITC as indicator (Echelon Biosciences #S-200F) and 10 % plasma or serum as analyte. In case of high fluorescence background of the analyte, 3 % plasma or serum may be used as well. Importantly, analyte concentrations must be the same to compare samples with each other. HDL-S1P complexes were determined using the complex dissociation method (CapDis) with 500 nM S1P-FITC as indicator and 10 % plasma or serum as analyte. For both methods, consistent washing protocol was applied prior to injection of every sample - the capillary was rinsed with 1 M sodium hydroxide at 3500 mbar for 45 seconds. Subsequently, the capillary was equilibrated with phosphate-buffered saline (PBS) at 3500 mbar for 75 seconds. The analyte solution (CapMix) or PBS (CapDis) was filled into the capillary at 3500 mbar for 30 seconds, followed by the indicator solution at 50 mbar for 10 seconds. The indicator solution was pushed towards the measuring cell of the detector with analyte solution (CapMix) or PBS (CapDis) at 400 mbar for 200 seconds. Sample trays for analyte and indicator were cooled at 8 °C, the measuring cell was heated to 37 °C.
Results
Binding of S1P-FITC to HDL and SA-S1P
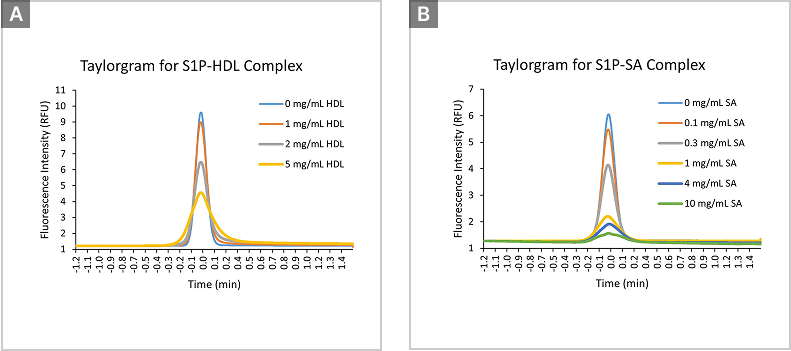
FIDA technology can determine the absolute size of molecular complexes by determining the hydrodynamic radius of selective fluorescent molecules like fluorescein-labelled S1P (S1P-FITC), which binds to the endogenous non-fluorescent carrier molecules HDL and SA in complex matrices such as plasma or serum. The hydrodynamic radius of unbound S1P-FITC was determined to be 0.8 nm, which is in line with the size of a small molecule. The size of S1P-FITC rose with increasing concentrations of SA and HDL- seen as broadening of the gaussian peak (Fig. 1). Calculated complex sizes were 3.4 nm for SA-S1P-FITC and 8.0 nm for HDL-S1P-FITC, which is in good agreement with the molecular sizes of both carrier molecules.
Competition of HDL and SA for S1P-FITC binding
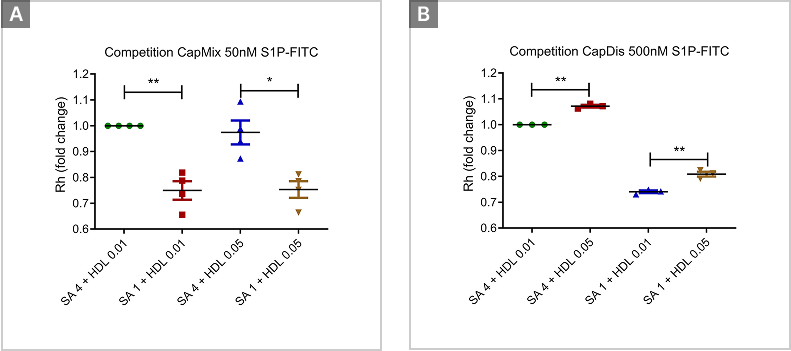
In order tosee the discrimination of HDL-S1P-FITC complexes and SA-S1P-FITC complexes, different concentrations of HDL and SA were mixed together and tested with the established CapMix and CapDis methods. 4 mg/mL SA and 0.05 mg/mL HDL were used as comparable concentrations of both carriers observed in 10% plasma from healthy donors. Reduced levels of one or both carrier molecules for S1P were observed under certain pathological conditions. Therefore four-times lower concentrations of both carriers were used to resemble 10% plasma of diseased patients and mixed with each other in PBS. The CapMix method was able to discriminate different concentrations of SA without a significant contribution of different HDL concentrations (Fig. 2A). On the other hand, the CapDis able to detect different concentrations of HDL in the presence of low and high concentrations of SA (Fig. 2B). It should be noted that the CapDis method also demonstrated similar differences in the hydrodynamic radius with high and low SA concentrations as the CapMix method. Therefore, it is important to run both methods in order to determine relative differences in S1P-FITC binding to HDL and SA.
Relative determination of HDL-S1P-FITC and SA-S1P-FITC complex formation in plasma samples
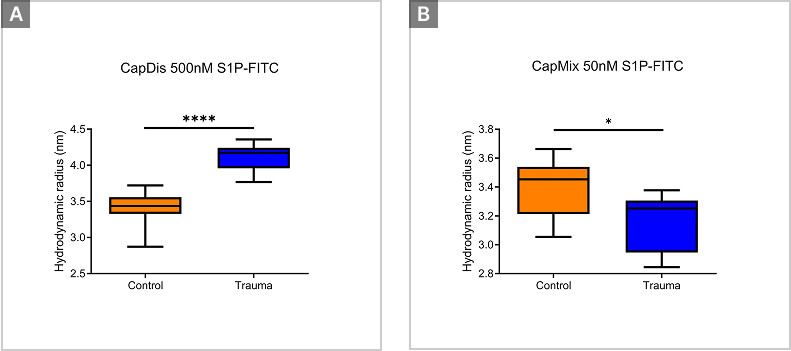
After establishing different complex formation in pure mixtures of HDL and SA, measurements in plasma derived from healthy donors and surgical trauma patients were processed and analyzed. Interestingly, relative S1P-FITC complex formation with HDL increased in surgical trauma patients compared to healthy controls (Fig. 3A), while formation of SA-S1P-FITC complexes decreased (Fig. 3B). Analyses using liquid chromatography coupled to triple-quadrupole mass spectrometry (LC-MS/MS) confirmed a shift of endogenous plasma S1P binding in surgical trauma patients compared to healthy controls with reduced SA-bound S1P and increased HDL-bound S1P, confirming the results obtained by the new FIDA methods (1).
Conclusion
FIDA technology enables the discrimination of relative S1P-FITC binding to HDL and SA in clinically relevant complex environments like plasma and serum. The methodology has been successfully used in different clinical studies to investigate S1P carrier usage under pathological conditions, enabling measurement of S1P binding states directly in patient samples. FIDA proved to be a useful tool to investigate dynamic carrier interactions of the lipid signaling molecule S1P without prior fractionation or purification steps.
For further details, please contact info@fidabio.com.
References
- Rapid determination of sphingosine 1-phosphate association with carrier molecules by flow-induced dispersion analysis top redict sepsis outcome.
Seidita I, Ziegler A, Qalaj A, Winkler MS, Nierhaus A,Kluge S, Levkau B, Gräler MH.
iScience 2024 Oct 15;27(11):111168. doi: 10.1016/j.isci.2024.111168. - The potential effect of albumin replacement on immune modulation and sphingosine-1- phosphate dynamics.
Winkler MS, Enzmann F, Schilder M, Seidita I, Moerer O, Gräler MH.
Sci Rep. 2026 Mar 25;16(1):10508. doi: 10.1038/s41598-026-45394-4. - Assessment of immunogenicity and drug activity in patient sera by flow-induced dispersion analysis.
Morten E Pedersen, Jesper Østergaard, Bente Glintborg, Merete L Hetland, Henrik Jensen
Sci Rep. 2022 Mar 18;12:4670. doi: 10.1038/s41598-022-08682-3 - Flow-Induced Dispersion Analysis for Probing Anti-dsDNA Antibody Binding Heterogeneity in Systemic Lupus Erythematosus Patients: Toward a New Approach for Diagnosis and Patient Stratification
Nicklas N. Poulsen, Morten E. Pedersen, Jesper Østergaard, Nickolaj J. Petersen, Christoffer T. Nielsen, Niels H. H. Heegaard, Henrik Jensen
Anal. Chem. 2016, 88, 18, 9056–9061