Fidabio Clone Selection Assay: Protein Expression Level and affinity directly in fermentation media without purification
Introduction
Clone selection is an important step in the production of proteins. Key factors include protein expression level, target binding (Kᴅ) and protein integrity (Rₕ). In this application note we look at the selection of optimal clones to produce nanobodies, also known as VHHs. VHHs are fragments of antibodies from Camelid animals and are gaining in popularity for protein research, diagnostics, and as therapeutical antibodies, given their simplicity in terms of development and production. The VHH clones are often characterized by ELISA or, following purification, SDS PAGE. However, these methodologies are hampered by low accuracy and low information content as well as the requirement for sample purification. Here, we introduce a new method offering the advantage of including protein affinity as a selection criterion together with the assessment of expression levels directly in cell matrices without need for purification or expression of tags on the VHH. A key to the information-enriched clone selection is that the absolute measure of size in nanometers makes it possible to identify the fraction of free antigen versus the fraction of bound antigen when mixed with a VHH solution. The degree of binding is a result of VHH expression level and affinity in combination. The Fida 1 instrument thereby enables an initial screening based both on clone performance and on protein quality, followed by a deconvolution of the Kᴅ and expression levels. The two parameters are identified in a stepwise approach, initially binding a known amount of fluorescently labelled antigen to the VHH content of a fixed volume of cell supernatant/cell lysate and thereafter titrating the mixture with known concentrations of un-labelled antigen. This twostep assay provides two correlations between measured size and VHH concentration plus Kᴅ respectively. Resolving the two correlations provides both Kᴅ and expression level without prior purification being required.
Material & Methods
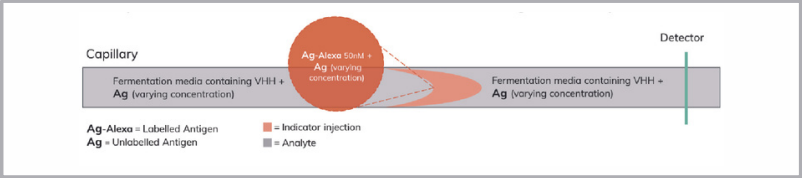
FIDA measuring principle: Flow Induced Dispersion Analysis is a capillary-based microfluidic method, exploiting that flow rate in the center of the capillary is faster than the one at the edges of the capillary. The resulting radial concentration gradients at the front and the tail of thed ispersion results in diffusion of your chosen indicator, which enables a “first principle” biophysical measurement of size. The FIDA measurement of size is broadly applicable for studying biomolecular stability, interactions, etc. The assay principle is illustrated in Figure 2. To learn more, visit fidabio.com.
Instrument: Fida 1 with 480 nm LED fluorescence detection. Fidabio standard capillary (i.d.: 75 μm, LT: 100 cm, Leff: 84 cm). The sample format was Fida 96 well microtiter plates.
Analyte: 10% VHH-containing non-purified E. coli fermentation media in 90% PBS buffer. Each VHH clone was titrated with increasing amount of unlabeled Antigen: 15, 30, 60, 125, 250, 350, 500, 1000, 2000 nM. The Fidabio Clone Selection assay was performed by filling the capillary with 6μL of 10% non-purified E.coli fermentation media containing the expressed VHH (Analyte), followed by injection of 39nL of a mixture of labelled Antigen (Indicator) and unlabeled Antigen, where the unlabeled Antigen was titrant and the labelled Antigen was kept constant.
Results
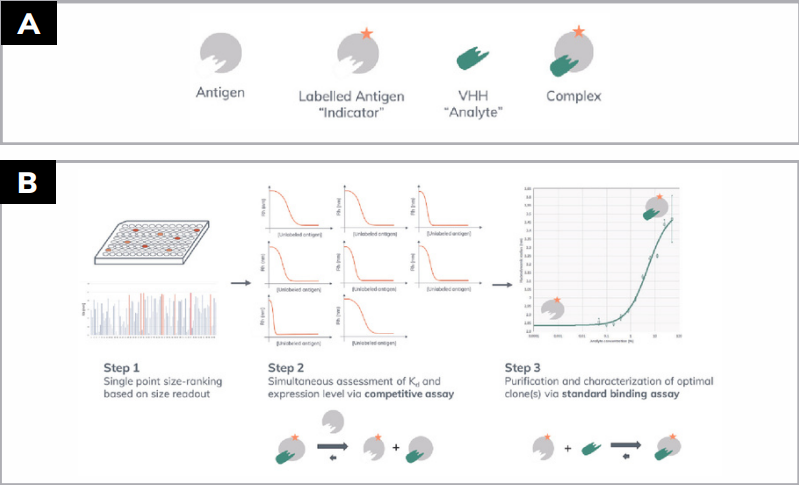
The Fidabio Clone Selection assay is divided into three steps:
Step 1 – Single point size-based ranking of 96 clones
Step 2 – Competitive assay on 8 selected clones
Step 3 – Accurate characterization of expression level and VHH affinity
Step 1 – Single point size-ranking of 96 VHH clones
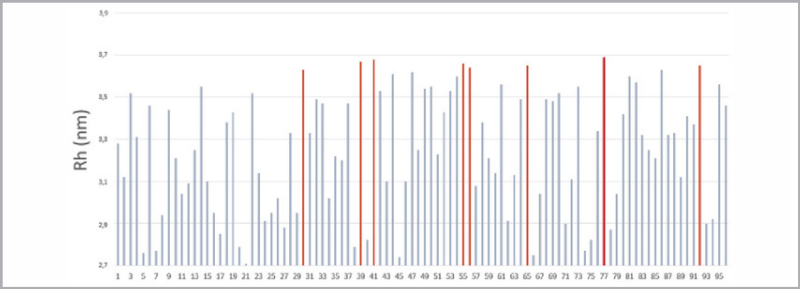
One of the advantages of the Fida 1 is that it provides an absolute measure of Rₕ in nanometers (Y-axis) which reveals the fraction of your protein of interest that is bound. It is possible to separately measure the size of the labeled Antigen alone (2.8 nm in the present example) as well as the size of the Antigen in complex with the VHH (3.6 nm) (Figure 3). All VHH clones in this study had the same size.
The hydrodynamic radius also serves as a QC check of the proteins since degradation results in changes in size and/or loss of binding. If a single-point size measurement of a clone is 3.6 nm, it means that the binding is saturated, either because of high expression levels or due to high affinity or a combination of the two.

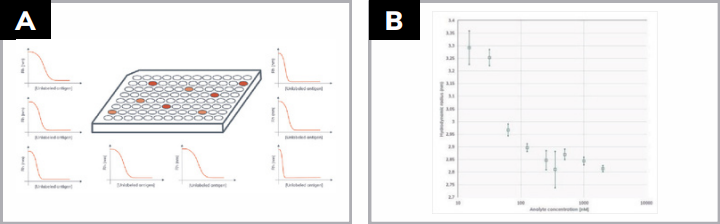
Figure 4 shows the single point size-ranking of the 96 clones; those in red represent the 8 highest read-outs. The process is fully automated accepting 96 well plates as sample format. The wells marked in red are selected for Step 2.
Step 2 – Competitive Fidabio assay on 8 selected clones
For each selected clone, a competition assay is performed in which increasing amounts of unlabelled Antigen is titrated into 10% clone-fermentation media (Figure 2). Figure 5A shows the reverse binding curves obtained by conducting the competitive Fidabio assay on the 8 selected clones. When excess amount of unlabelled Antigen is present it competes with the labelled antigen resulting into a decreasing size (Figure 5B). The reverse binding curves are fitted using the Fidabio Clone Selection model. An example of a binding curve is shown in Figure 5B. Since the apparent size (Rₕ) is linked to the fraction bound, the affinity and the VHH-expression level (concentration in the fermentation media) of the specific clones can be assessed simultaneously.
Step 3 – Accurate characterization of the best VHH clone
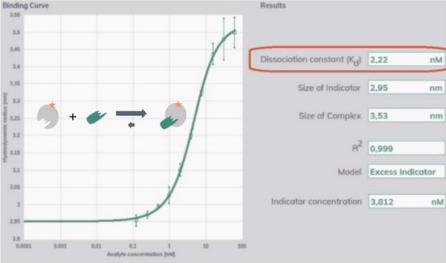
In Step 2, the best clone has been identified based on affinity and expression level. Subsequently, it is produced in larger scale and purified. It is possible to use Fida 1 for accurate affinity characterization using the purified VHH as analyte. In this step, the experiments are no longer run in 10% fermentation broth, but in 20nM NaHPO4, pH7.4, 140μM NaCl, 0.03% Pluronic F127. Figure 6 presents the results for the best VHH clone selected in Step 2. Here, the binding characterization was performed as a standard FIDA experiment, where the fluorescently labelled Antigen was constant at 20nM and pure VHH was titrated from 0.125 nM to 100 nM. The selected clone was identified to have an affinity of 2.2 nM. The size of the complex can be compared with structural data from the Protein Data Bank using the Rₕ predictor in the Fida 1 data analysis software.
Conclusions
With the Fidabio Clone Selection assay, it is possible to take advantage of the absolutes size readout in nanometers and thereby,
1. Increase the likelihood of selecting your best protein candidates by including their functional performance (affinity) early in the selection process, as alternative to only relying on expression levels.
2. Eliminate the need for purification steps during your selection process.
3. Work with your native protein without having to express it with His- or other tags.