Label-free biophysical assays using nanoliter sample volumes
Introduction
Proteins exhibit the unique ability to emit intrinsic fluorescence which comes from the three aromatic amino acids: tyrosine, phenylalanine, and tryptophan. The emission spectrum of Tryptophan, which is the dominant intrinsic fluorophore, is highly sensitive to the local environment that can change due to conformational transitions, binding events, or denaturation. The detection of the fluctuation in proteins’ intrinsic fluorescence allows for the study of their structure and function in response to these changes*.
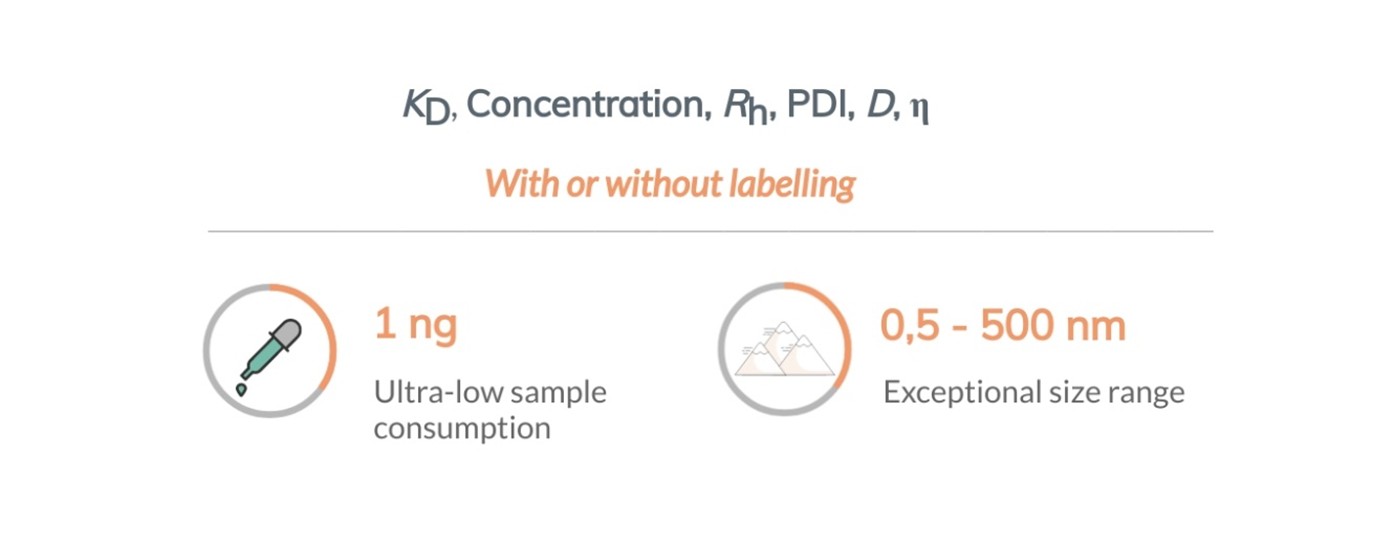
The new Fidabio UV fluorescence detector expands the numerous possibilities offered by the Fida 1 platform that can now support both labelled and label-free assays. The new UV detector enables immobilization- and label-free characterization of proteins and complexes in the size range from 0,5 to 500 nm in Rh, i.e. particle size up to 1000 nm Dh.
A Fida 1 instrument can alternate between colored, and UV-based fluorescence detection to unlock the endless possibilities offered by diverse wavelengths. Key parameters offered by the Fida 1 platform include: Binding (KD), Concentration, Size (Rh), polydispersity index (PDI), Diffusivity (D), Viscosity (η), and Aggregate counting using only nanoliter sample volumes.
In this white paper, we present how the Fidabio UV fluorescence detector is utilized in different assays for label-free sizing and determination of protein stability.
Protein sizing
In-solution structural validation using the Fidabio PDB Correlator
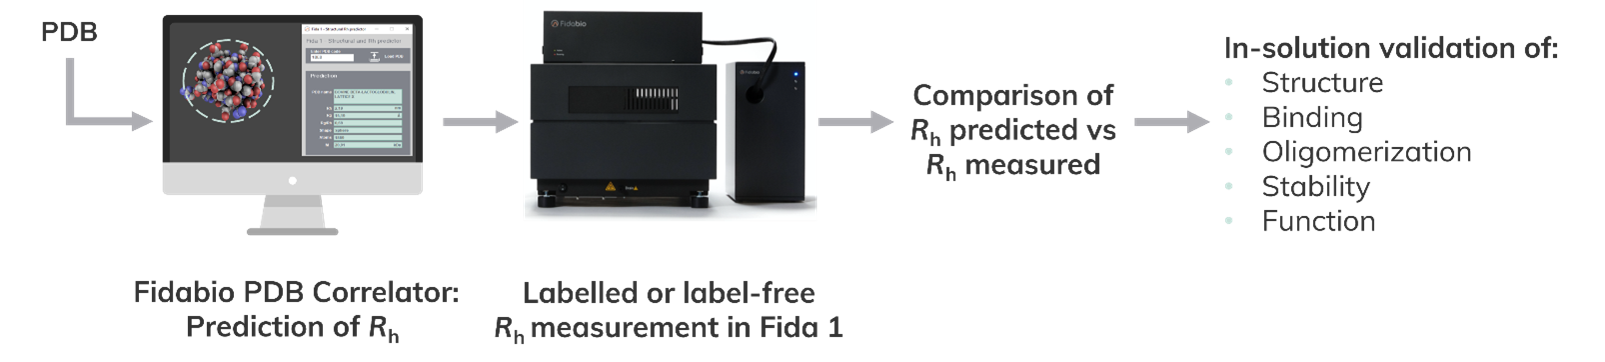
The Fidabio PDB (Protein Data Bank) Correlator is an integrated part of the Fidabio software and predicts the Rh of proteins based on PDB and AlphaFold structural data. The comparison of predicted Rh with Fida 1 Rh measurements offers insights in the protein’s structure. Figure 1 shows the general workflow for in-solution structural validation using the Fidabio PDB Correlator.
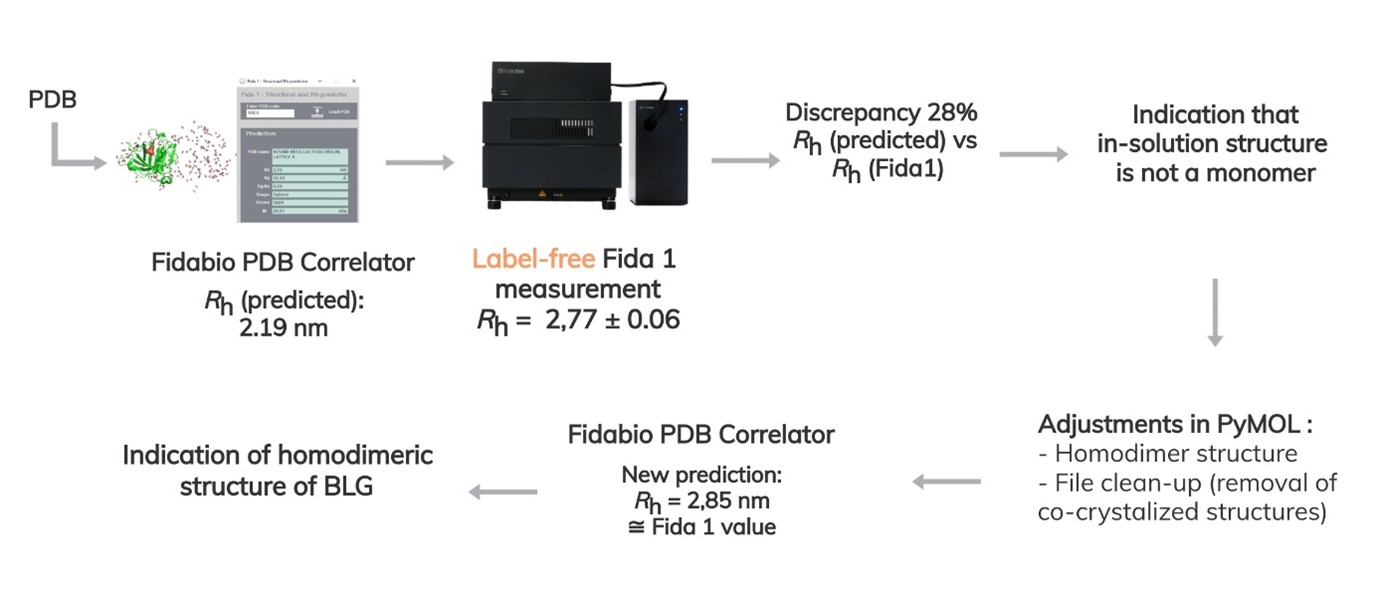
Here, we show how structural indications were extracted for bovine β-lactoglobulin (BLG) without labelling the protein. The size of the BLG was predicted based on the PDB file using the Fidabio PDB Correlator and subsequently size measurements were carried out using the Fida 1 configured with the Fidabio 280 nm LED fluorescence detector. By comparing the two values, an indication of dimerization was returned (Figure 2).
Access the ‘’PDB Correlator’’ Application Note here.
Sizing of E3 ligase
The measurement of the size of individual binding partners is the starting point for size-based analysis of complex formation. The combination of label-free and label-based capabilities in a single platform allows for an initial simple and label-free size determination of individual partners followed by the characterization of binary or ternary complex formation using labelled proteins. Figure 3 illustrates the E3 ligase (blue sphere) that induces poly-ubiquitination and degradation of target proteins (red sphere). To verify the size of the unlabeled E3, the intrinsic fluorescence of the protein was measured showing an E3 Ligase Rh of 5.8 nm.
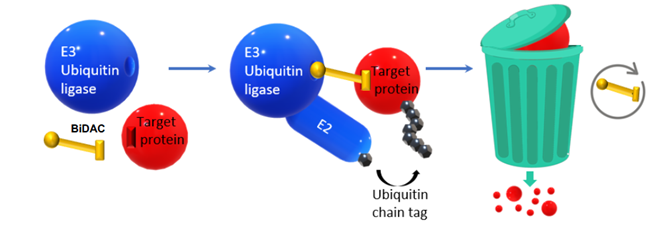
Access the ‘’Targeted Protein Degradation’’ Application Note here.
Particle sizing
AAV2 sizing and aggregation detection following different sample preparations
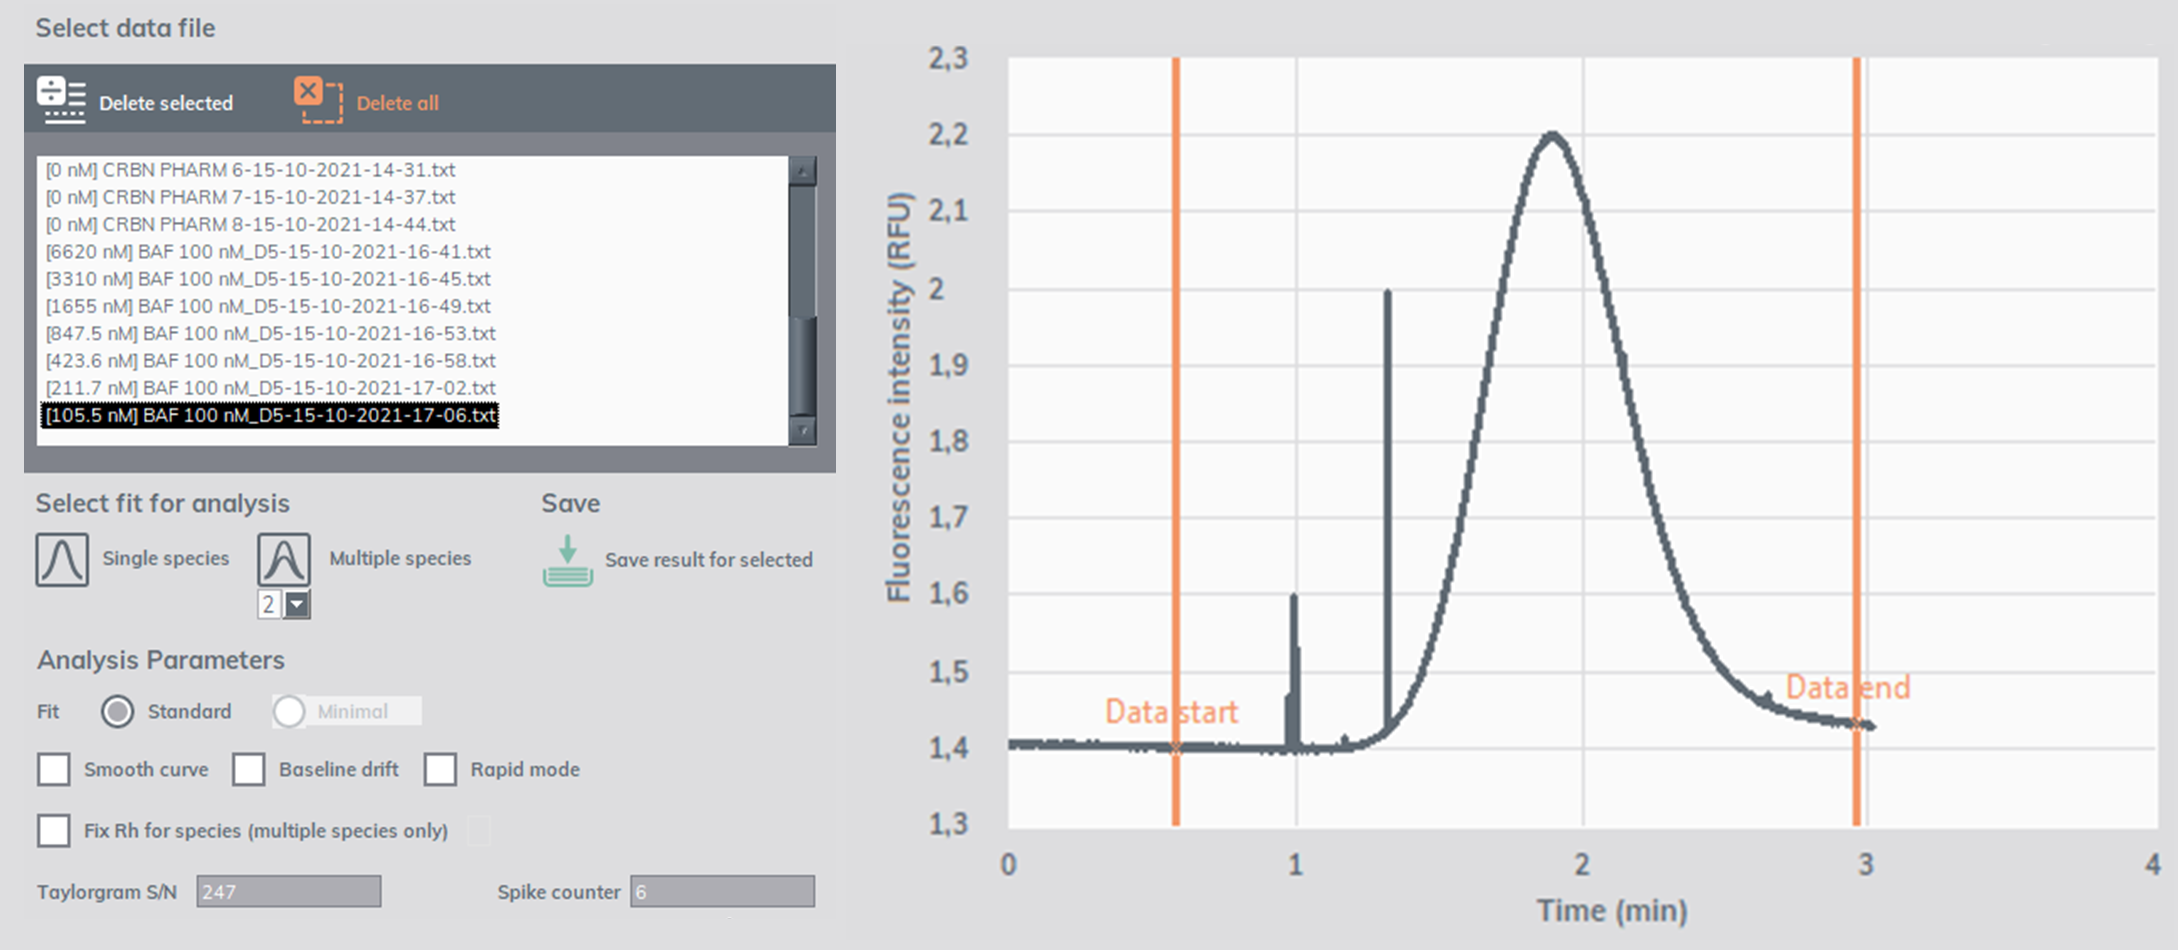
Adeno-associated virus 2 (AAV2) particles were characterized using the UV fluorescence detector after 2 different sample preparations. The integrated software tools ‘’Spike counter’’ and ‘’Polydispersity Index (PDI)’’ were used to generate information on aggregation events and polydispersity of the AAV2 sample, respectively. The Spike counter calculates the ‘’jumps’’ of the fluorescence signal. Each one of these spikes represents one aggregate (Figure 4) or one microdrop. This enables the use of Fida 1 also in other areas, such as Liquid Liquid Phase Separation (see the publication here).
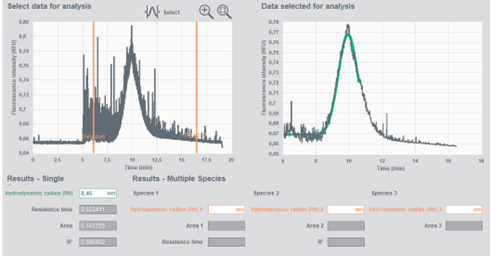
The PDI tool generates a PDI index similar to DLS technology, providing insight into the size distribution of a given sample. Single species exhibit a PDI approaching zero, whereas samples with higher size heterogeneity return higher index values. particles was measured to be 8,5 nm(Dh=17 nm), PDI≈0,2 and Spike counter=830 in the 40 nL of sample used. This revealed a high degree of aggregation – 2,1×10⁷ aggregates/ml (multiple spikes in Figure 5A).
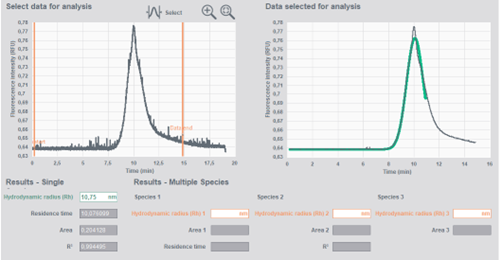
2nd sample preparation: the apparent hydrodynamic radius (Rh)of the particles was measured to be 10,8 nm (Dh=21,6 nm), PDI≈0,2and Spike counter=46 in the 40 nL of sample used. This revealed a comparatively low degree of aggregation - 1×10⁶ aggregate/ml (fewer spikes in Figure 6A).
Protein stability
Immobilization- and label-free determination of protein stability
The assessment of protein stability as a function of destabilizing factors, such as temperature and denaturants, is very important in drug development to ensure efficacy and safety.
FIDA generates stability information on two structural levels: local and global. The accurate, absolute measurement of size (Rh) is ideal for tracking conformational changes of proteins on the global level, while the extra-responsive fluorescence signal can reveal structural transitions that take place locally in the protein. Here, we present how FIDA tracks the global and local unfolding of HSA without any use of extrinsic fluorophores. The stability of HSA was tested under increasing concentration of urea. The measurements can be performed in a Pre-mix or Capillary Mix setup. Capillary Mix includes an initial filling of the capillary with analyte and the subsequent injection of the fluorescent indicator (in this case HSA). The two partners are mixed and interact with each other directly in the capillary when pressure is applied. Thereby, sample preparation and consumption are significantly reduced.
The changes in HSA Rh was plotted as a function of increasing urea concentration (0-7 M) as shown in Figure 7A. An increase in urea concentration around 4.0 M led to unfolding of HSA, observed as increase in size from 3.5 nm to 6.2 nm. The results correlated well with a similar study using small-angle X-ray scattering (SAXS).
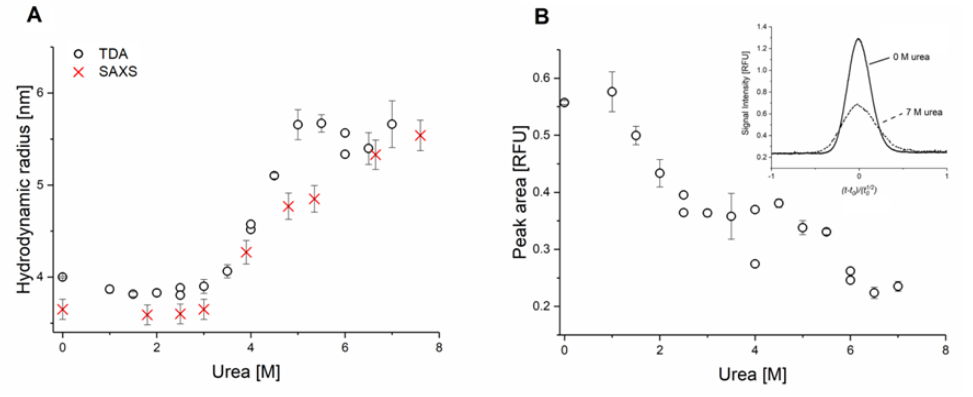
The peak areas of the curves were exploited for simultaneously probing the intrinsic fluorescence intensity of HSA at increasing urea concentration.
Intrinsic fluorescence of HSA was affected by urea at 1.5 M indicating local structural changes prior to the overall unfolding (Figure 7B). This showcases the unique ability of FIDA to measure both local and global structural changes in a single label-free measurement.
Access the ‘’Protein stability’’ Application Note here.
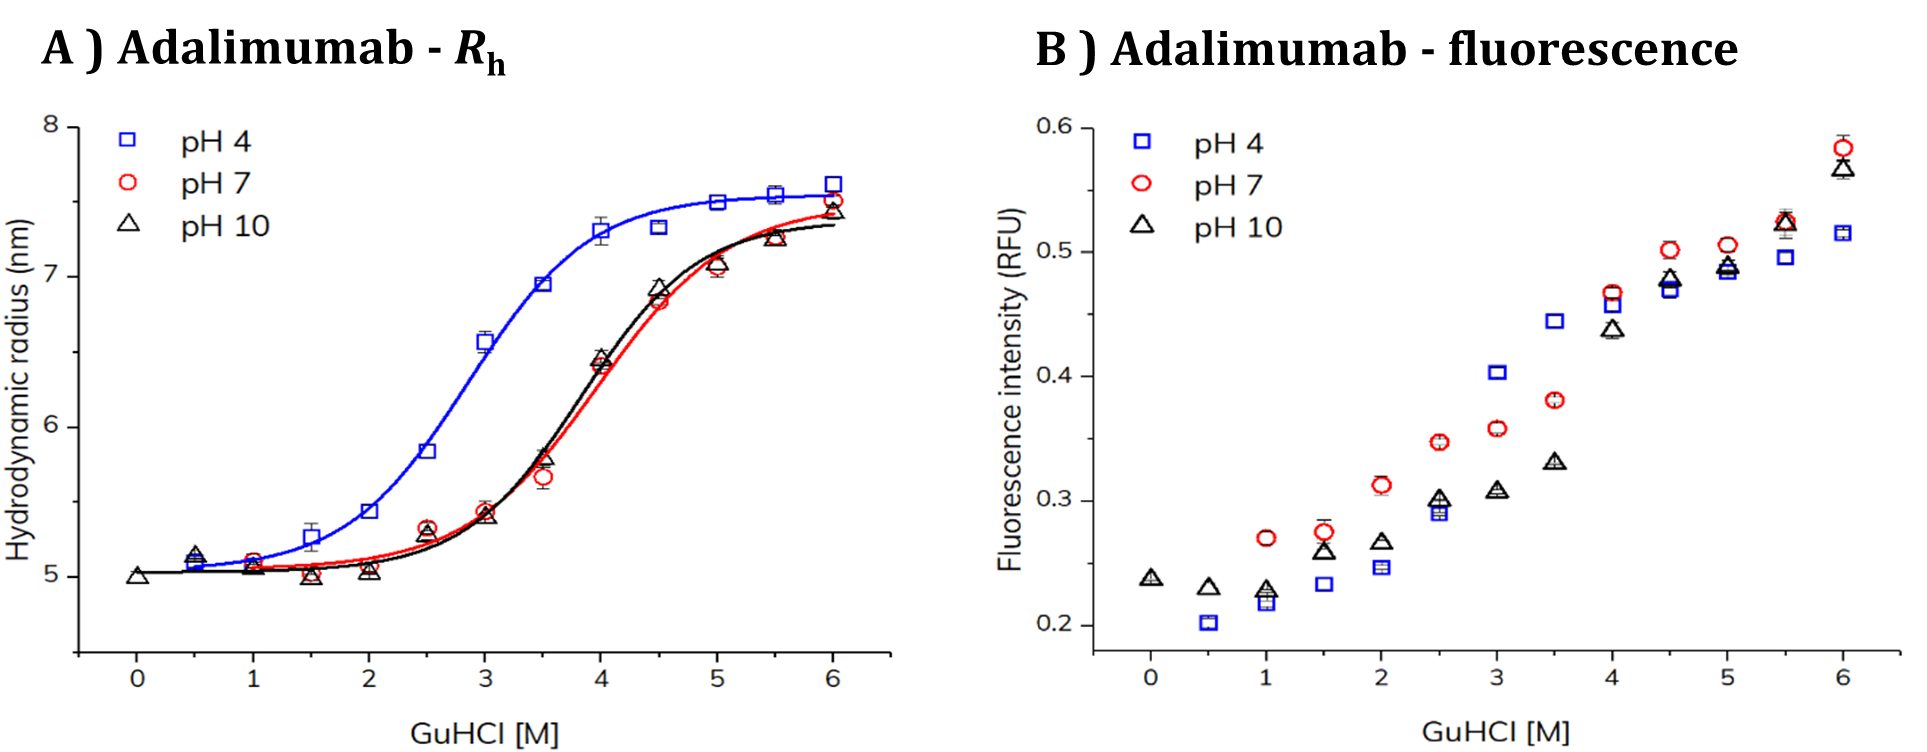
In another project, the stability of HSA and Adalimumab was examined under 36 different conditions, with a fully automated assay. Using the Capillary Mix setup, only ~100 ng of each protein was used to produce a large amount of data. The changes in HSA and Adalimumab Rh were plotted as a function of increasing GuHCl concentration under three different pH conditions (Figure 8A and 9A, respectively). At pH=4an increased HSA Rh is observed early on indicating unfolding of the protein due to acidic conditions.
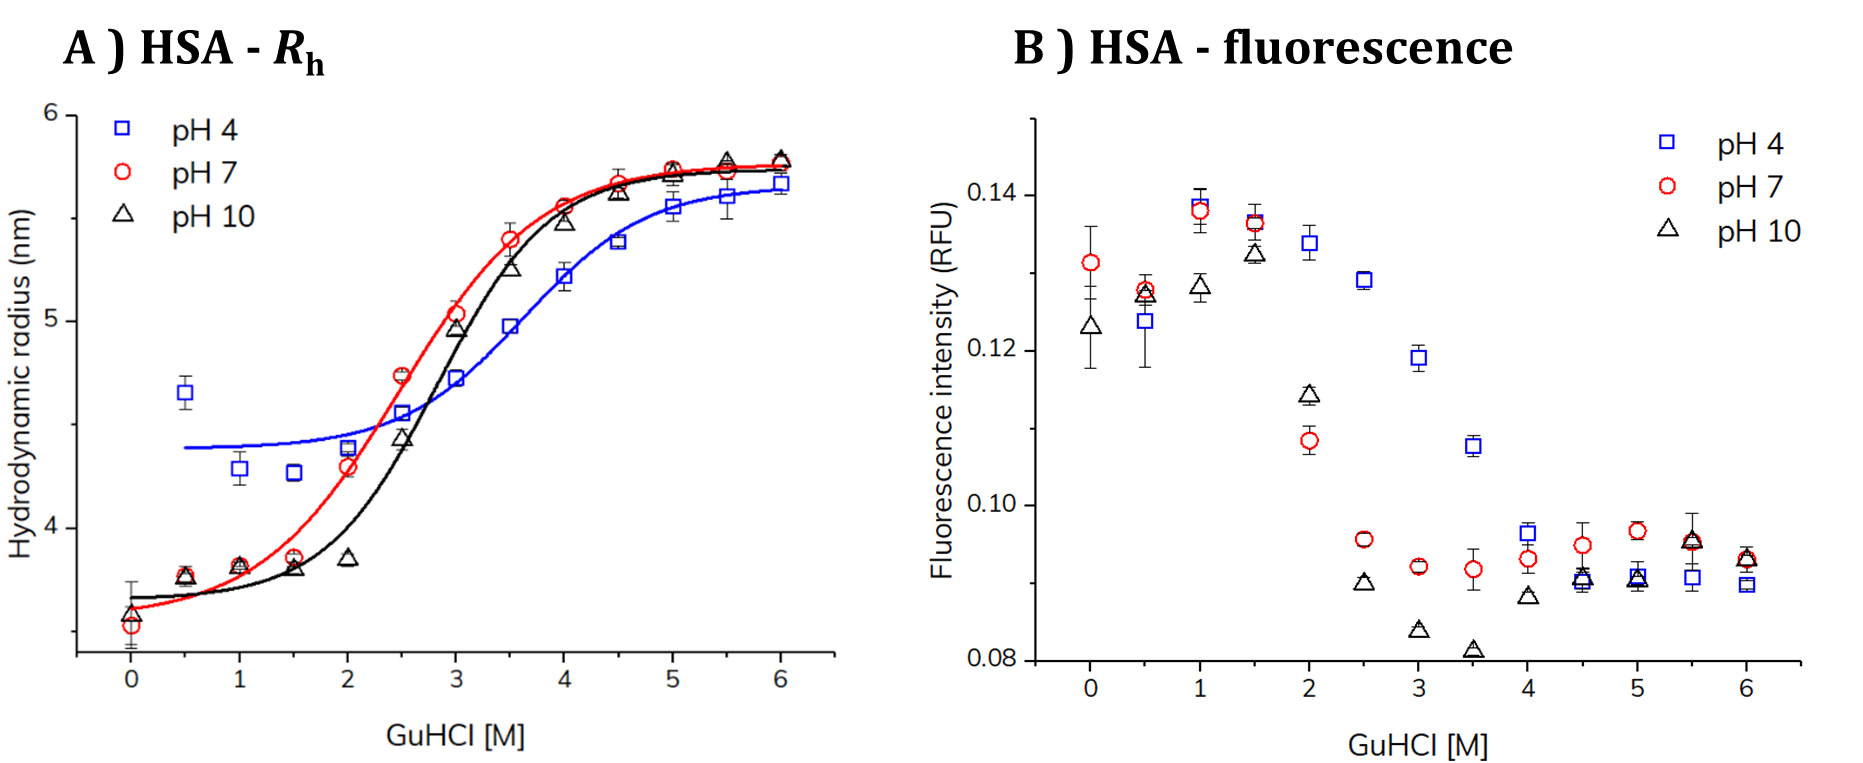
In contrast to HSA, the intrinsic fluorescence ofAdalimumab (Figure 9B) increases at higher GuHCl concentration. Adalimumab contains many Tryptophan residues that, in the folded conformation of the antibody quench each other leading to a decreased fluorescence signal. When the protein unfolds, however, the intramolecular quenching is reduced and fluorescence increases.
Learn more at www.fidabio.com.