
Linking Structure and Function: Use PDB data as the baseline for your Fidabio characterisation
INTRODUCTION
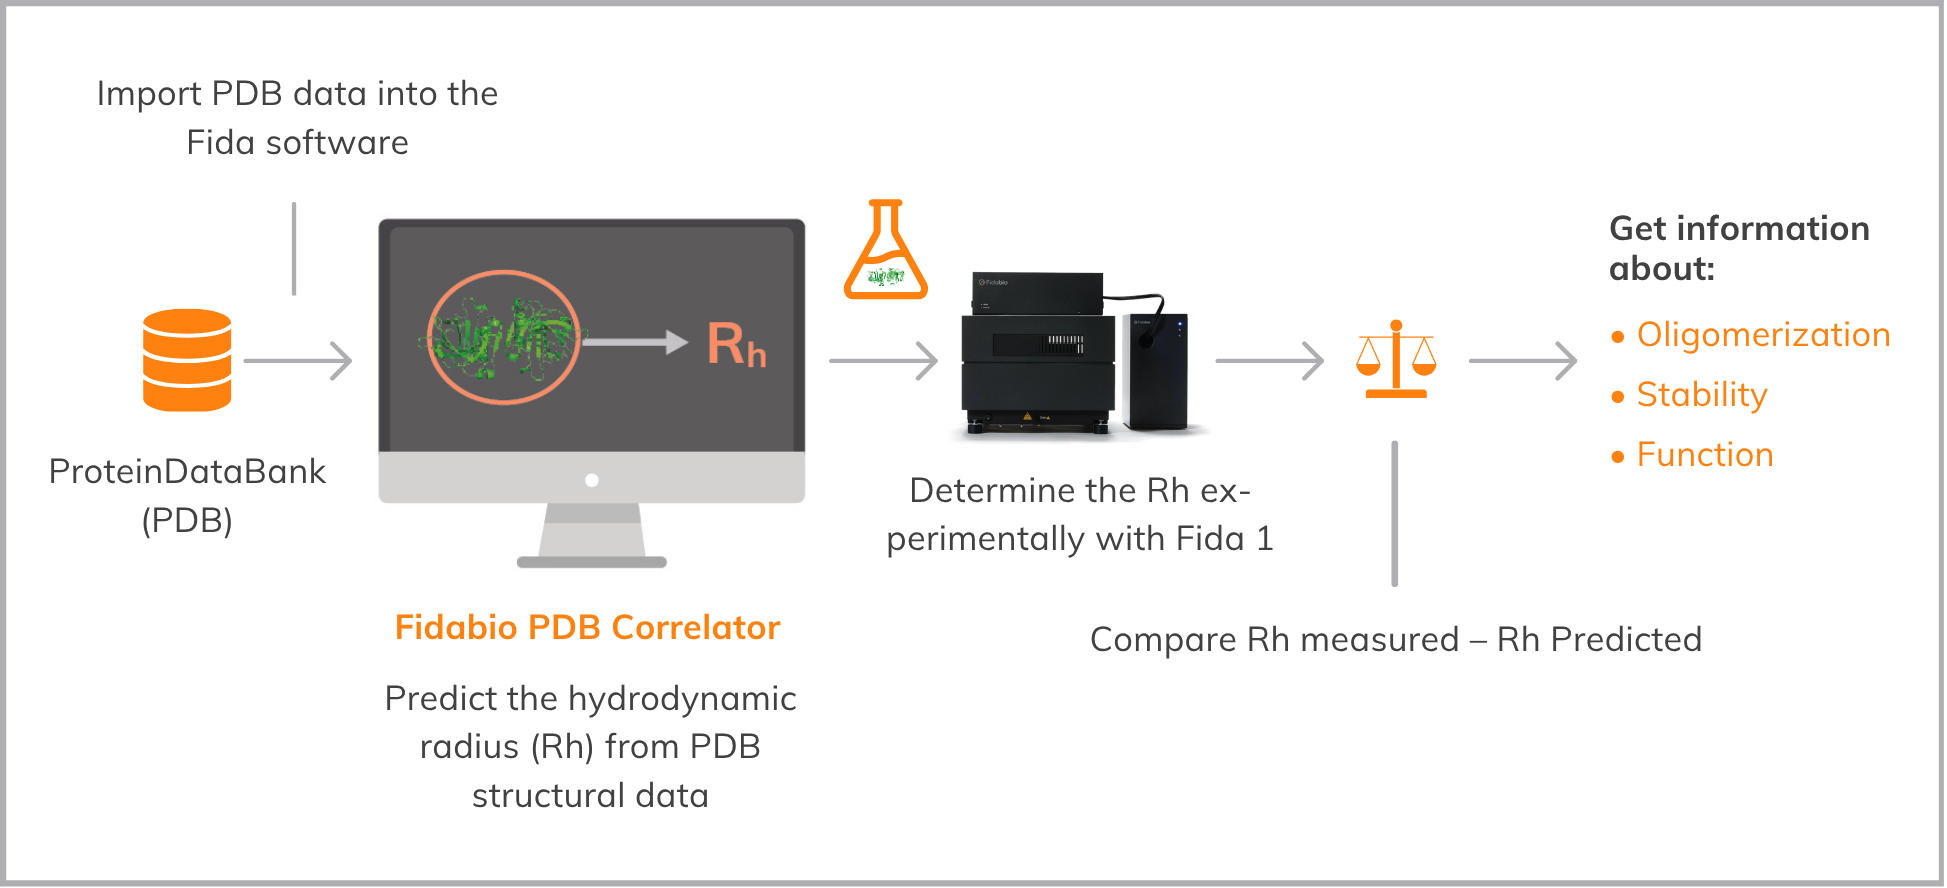
In biophysics, the detection of molecular size changes is a strong, quantitative source of information about the structure of a protein and its complexes. However, correlating a protein’s structure to size measures, like Hydrodynamic radius (Rh), requires consideration of structural features of the protein and its assemblies based on either experimental structures or predicted ones by e.g. AlphaFold [1]. To establish a strong and reliable size baseline, we have developed the Fidabio PDB (Protein Data Bank) Correlator. In the examples below we use the Fidabio PDB Correlator to predict the in solution Rh of bovine β-lactoglobulin, human serum albumin, bovine serum albumin and chicken lysozyme (Figure 2). Subsequently, using Fida 1 equipped with a UV fluorescence detector, the Rh of label-free proteins is experimentally determined and compared with the predicted Rh values. The workflow is illustrated in Figure 1. In this way, we can make accurate correlations between structural data and in-solution Rh measurements. Such an approach would enable validation of structures predicted by AlphaFold [1]. The Fidabio PDB Correlator is also applicable when you are working with fluorescently labelled proteins and using a fluorescence detection at coloured wavelengths.
FIDA measuring principle
Flow Induced Dispersion Analysis is a capillary-based microfluidic method, exploiting that flow rate in the centre of the capillary is faster than the one at the edges of the capillary. The resulting radial concentration gradients at the front and the tail of the dispersion results in diffusion of your chosen indicator, which enables a “first principle” biophysical measurement of size. The FIDA measurement of size is broadly applicable for studying biomolecular stability, interactions, etc. To learn more, visit fidabio.com.
Material & Methods
Fida 1 instrument with Fidabio 280 nm LED fluorescence detection for sizing experiments (Fida Biosystems ApS). Fidabio standard capillary (i.d.: 75 μm, LT: 100 cm, Leff: 84 cm). Bovine β-lactoglobulin (BLG), Human Serum Albumin (HSA), Bovine Serum Albumin (BSA) and Chicken lysozyme (LYZ) were all dissolved in buffer (1 x PBS). The buffer was used as analyte. Sample analysis was performed by filling the capillary with the analyte, followed by an injection of pre-incubated indicator, which was mobilised towards the detector with analyte at 400 mbar. LYZ was measured on a capillary coated with HS reagent (Fida Biosystems ApS). The Fidabio PDB Correlator was used to correlate hydrodynamic radius and molecular weight. Crystal structures were acquired from the Protein Data Bank (https://www.rcsb.org/). Removal of crystallographic water, co-crystalised molecules and additional PDB file clean-up and visualisation was done using PyMOL 2.5.0 (Schrödinger LCC). Data analysis was done using the Fida Software. All standard deviation is given as the experimental error of nine replicates.
Results
Label free Rh – Structural correlation using the Fidabio PDB Correlator The Fida 1 instrument configured with a Fidabio UV fluorescence detector provides a label free and absolute measurement of hydrodynamic radius (Rh). It was used to measure the size of Bovine β-lactoglobulin (BLG), Human Serum Albumin (HSA), Bovine Serum Albumin (BSA) and Chicken lysozyme (LYZ). BLG is a homodimer at neutral pH, the rest are well characterised monomeric proteins [2-5]. Using the Fidabio PDB Correlator, the PDB data are loaded Into the Fida Software which subsequently returns the predicted mass and Rh. For large monomeric proteins, the predicted mass is within 2 % of the theoretical value (Table 1 and Appendix). For small proteins, however, it is recommended that PDB files are cleaned up, when they contain structures of co-crystallised molecules. Figure 2 illustrates the process of cleaning up the structure using PyMOL.
.png)
.png)
(A) PDB file for BLG (1BEB) loaded directly from PBD using the Fidabio PDB Correlator
(B) PDB file generated using the PyMOL Molecular Visualisation System
(C) PDB file with crystallographic waters removed
(D) Removal of co-crystalised molecules and additional clean-up for correct oligomeric state. In this particular case no Rh difference occurs with the removal of co-crystalised molecules (Rh=2,85 nm in both steps C and D). However, this is an important process for many crystal structures that have rather large co-crystalised molecules which can influence the Rh predictions.
Without clean-up the apparent Rh of LYZ, BSA and HSA is within 10% of the experimental Rh. The correlation can be improved by removing co-crystalised molecules, leading to 0.3% accuracy (theoretical values compared to the experimental data) (Table 1). BLG is predicted to have an Rh of 2.19 nm, but the experimental value is 28% off (Appendix-Table 1)
Pointing to an in-solution structure different from a monomer. Cleaning up the file and using a homo-dimer structure yields an Rh of 2,85 nm, which is within 2,8% of the experimental value of 2.77 ± 0.06 nm. This indicates that BLG is a homodimer, which has also been extensively shown in literature [2].
Conclusions
The data show that oligomeric states and hydrodynamic radius of a given protein can be identified label free in solution using very small amounts of sample (~40 nL/run at 0.1 g/L). The Fidabio PDB Correlator provides an accurate correlation of protein hydrodynamic radius (<9% error) and can be used to for correlating hydrodynamic radius to structural data or AlphaFold structural predictions.
References
1. Jumper, J et al. Highly accurate protein structure prediction with AlphaFold., 2021, Nature.
2. Brownlow S. et al.; Bovine beta-lactoglobulin at 1.8 A resolution--still an enigmatic lipocalin., 1997, Structure; Vol 5, p. 481-495.
3. Sugio S. et al.; Crystal structure of human serum albumin at 2.5 A resolution., 1999; Protein Engineering Vol 12: 439–446.
4. Bujacz, A.; Structures of bovine, equine and leporine serum albumin., 2012; Acta Crystallography D, Vol 68: 1278-1289
5. Vaney, M.C. et al.; High-resolution structure (1.33 A) of a HEW lysozyme tetragonal crystal grown in the APCF apparatus. Data and structural comparison with a crystal grown under microgravity from SpaceHab-01 mission. 1996 Acta Crystallography D Biological Crystallography, Vol 52: 505-517.
Appendix
Table A1. Predicted (4th column) and measured values (3rd column) of Rh. -H2O: removal of crystallographic waters. -CC: removal of co-crystalised molecules. AC: additional clean-up, modifying files for correct oligomerisation. Orange: >10% difference between predicted and measured values. Green: <10% difference between predicted and measured values (accepted difference).
.png)
*BLG is a homodimer