
Quantification and Characterization of Exosomes
INTRODUCTION
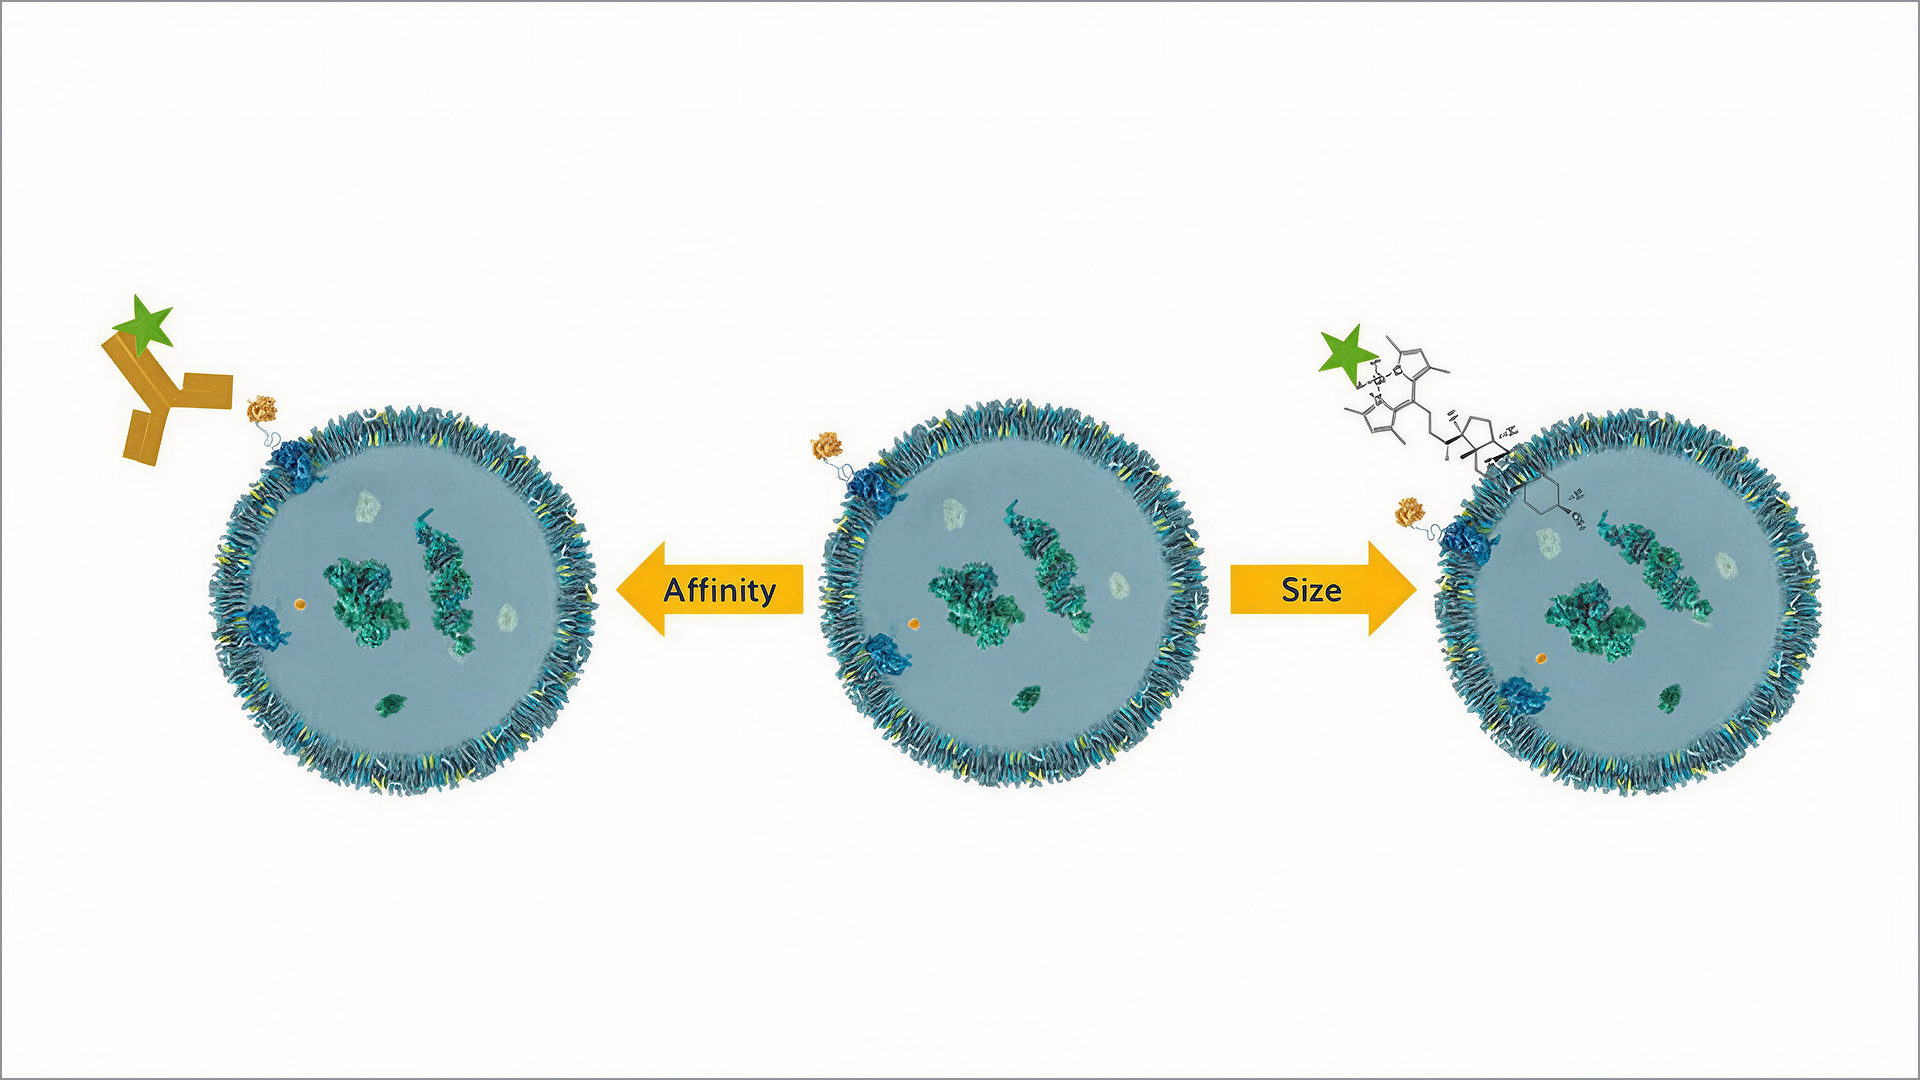
Exosomes are a type of extracellular vesicles released from cells. They contain constituents of the cells including proteins, DNA and RNA and act thereby as shuttles of certain genetic information to other cells (1). Communication between distant cells through exosomes is recognised in various disorders such as cancer, neurodegenerative and inflammatory diseases. Therefore, there is increased interest in the research around applications of exosomes in the field of diagnostics and cell therapy (1). The present application provides an insight into characterisation of exosomes in terms of size, quantity, and affinity, by using Flow Induced Dispersion Analysis (FIDA). FIDA is a capillary-based technology for measuring binding affinity and complex size of biomolecules under native conditions (2,3,4). In the present project, an anti CD81 antibody and an anti-exosome antibody were used to probe binding affinities of exosomes in assay buffer and spent medium. Cholesterol-TopFluor was used as an indicator for sizing of exosomes.
Material & Methods
The experiments were conducted with the Fida 1 instrument employing 488 nm laser induced fluorescence detection, using Fida standard capillaries (i.d.: 75 μm, LT: 100 cm, Leff: 84 cm).
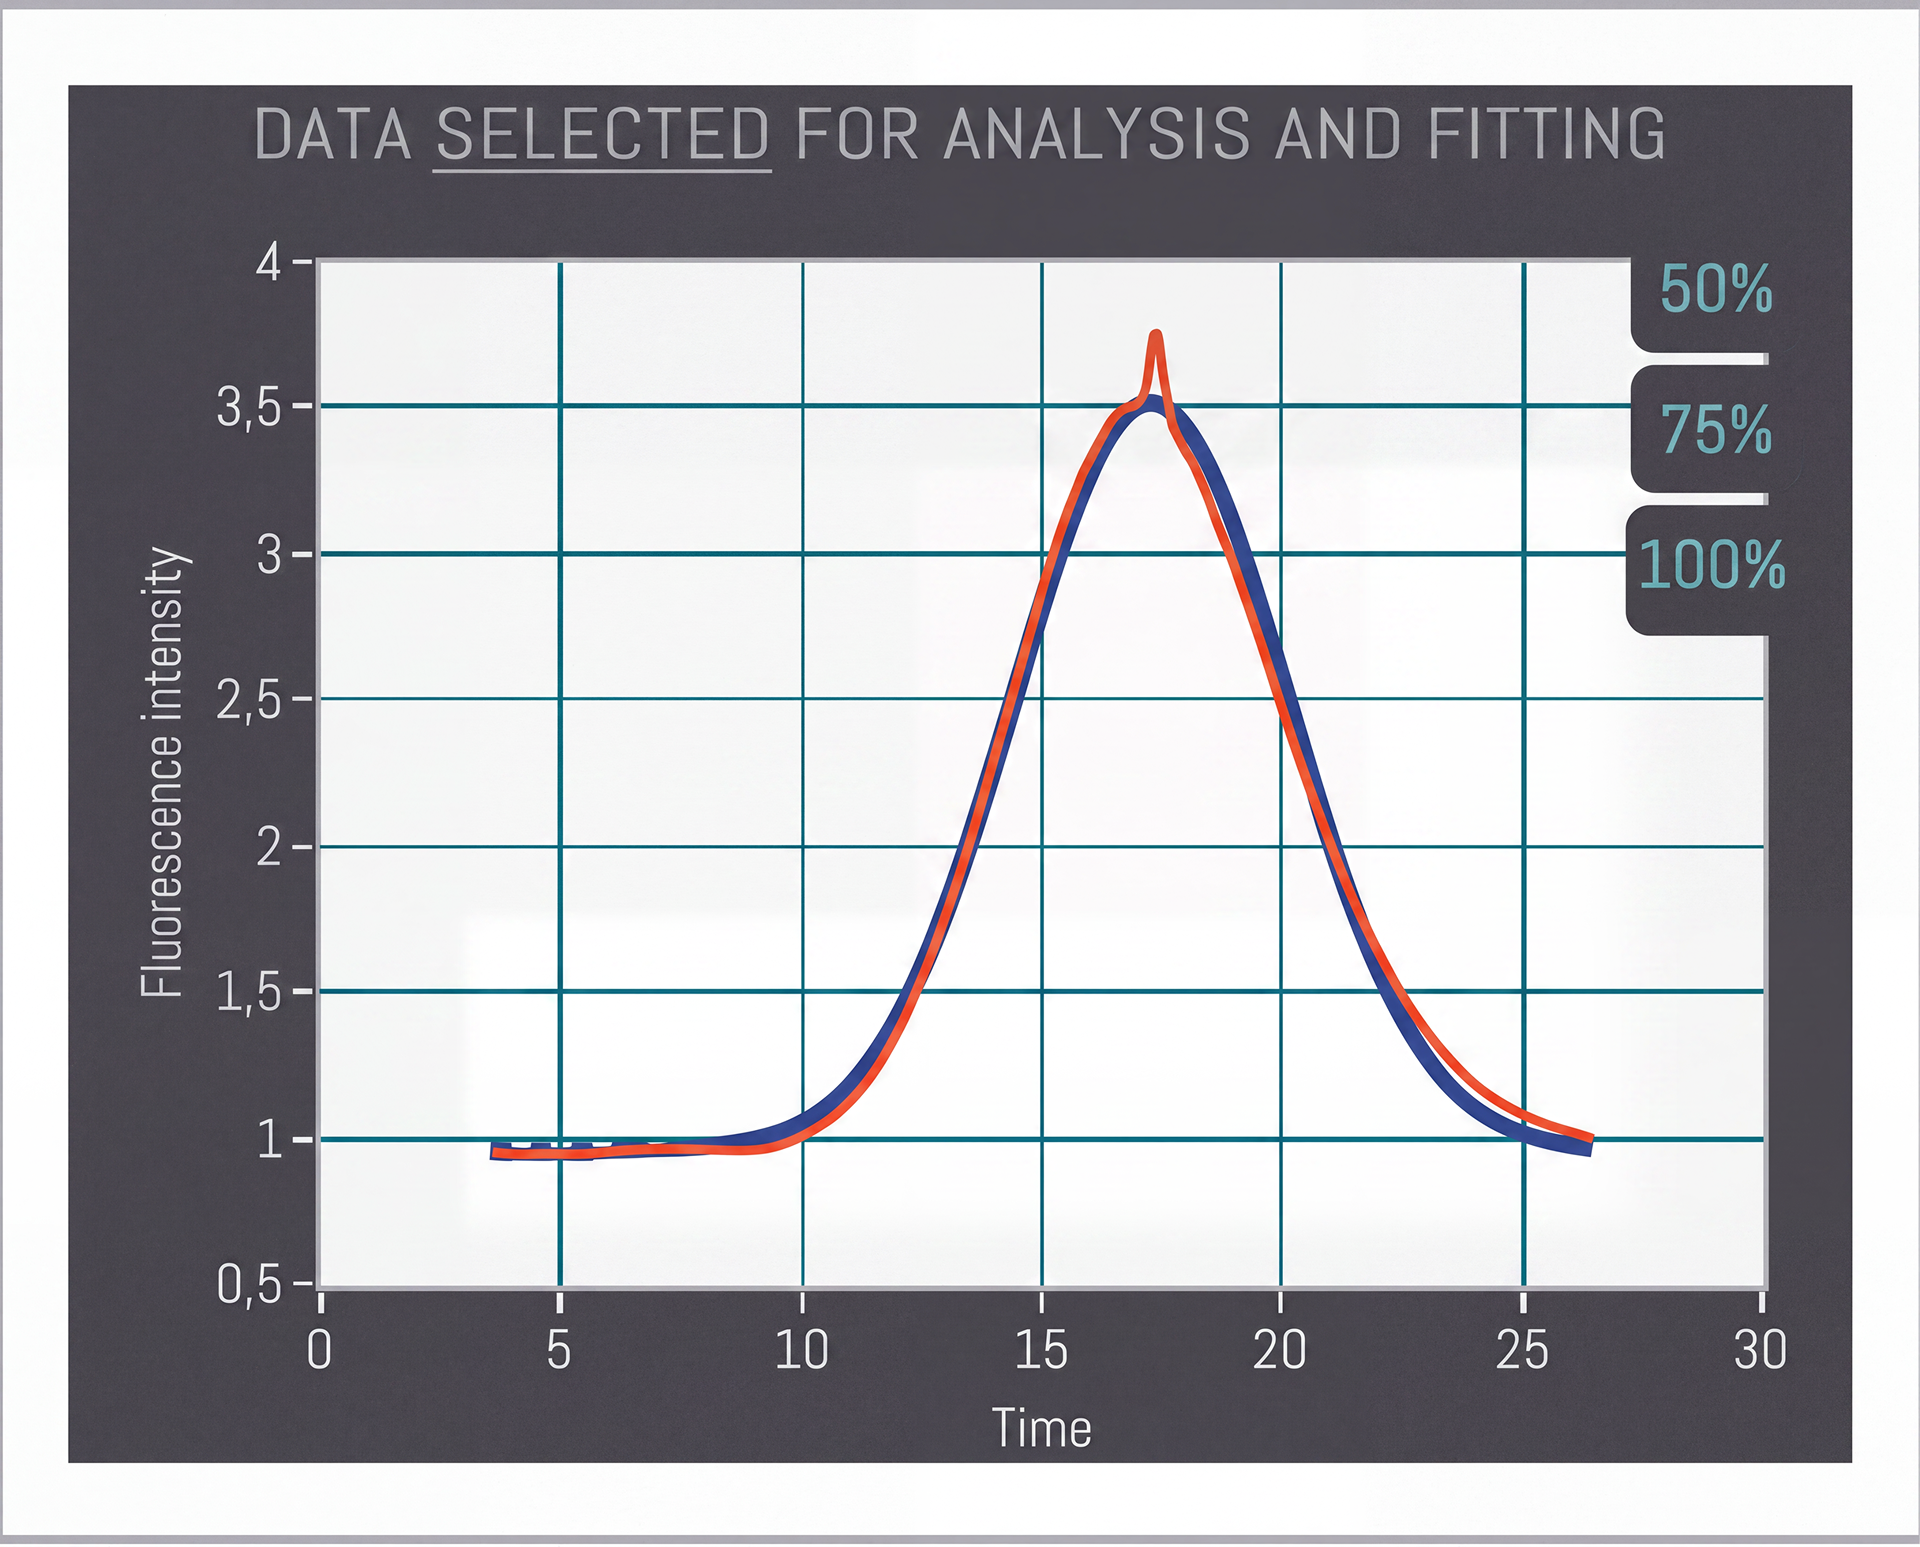
Sample analysis was performed by filling the capillary with 4 μL of exosome solution, followed by injection of 39 nL of antibody which was mobilised towards the detector with the exosome solution at 50 mbar for 27 min at 25 °C, pH 7.4. The affinity measurement was performed at a fixed concentration of 10nM of anti-CD81 antibody, 1000nM of cholesterol-TopFluor and 100nM of anti-exosome antibody which were titrated against varying concentrations of exosomes. Data analysis was performed using the dedicated Fida software.
Results
Anti-CD81 binding to exosomes
The FIDA technology provides an absolute measurement of molecular size (i.e. hydrodynamic radius) for a selective binder (antiCD81 antibody) as it interacts with the analyte of interest (exosomes). The hydrodynamic radius (size) of free anti-CD81 antibody was determined to be 5nm which is in line with the size of an antibody. The apparent size of anti-CD81 antibody increased upon titration with the exosome solution both in buffer (Figure 2) and in medium (Figure 3). The size of the complex was determined to be 44.3-51.3nm. The apparent Kd measured in buffer (60.4) and medium (73.5) was in good agreement highlighting the reproducibility of the assay under native conditions.
%20Raw%20data%20for%20anti-CD81....png)
%20Raw%20data%20for%20anti-CD81....png)
The binding curve is an effective way for quantifying exosome interactions and thus for a full functional exosome characterisation. However, the binding curve may also be used for selective quantification directly in fermentation media as has been previously shown for IgG (5). The limit of quantification was increased by an order of magnitude in a recent assay where a quick ultrafiltration step was introduced (Figure 4). This serves as a proof of concept for quantifying exosome concentration on an early fermentation stage.
%20Raw%20data%20for%20anti-CD81%2C%20as%20a%20function%20of%20exosome...%201.png)
Anti-exosome antibody binding to exosomes
The hydrodynamic radius (size) of the anti exosome antibody was determined to be ~ 5 nm, which is in agreement with the expected size of an antibody. The apparent size of the antibody increased upon gradual titration with the exosome solution. This was also visually observed from the raw data (figure 5A), where an increase in exosome concentration led to decrease in free anti-PTGFRN (narrow peak) with simultaneous increase in exosome-bound anti PTGFRN (broad peak). The apparent affinity (Kd) between anti-exosome antibody and the exosomes was determined to be 1E10 p/mL from the binding isotherm applied in figure 5B and the complex size was determined to be 103 nm.
%20Raw%20Taylorgrams%20of%20anti-PTGFRN%20as%20a%20function...%201.png)
The hydrodynamic radius (size) of anti-exosome antibody was measured in 0-90 % v/v spent medium, in order to evaluate potential sample matrix interference. Here, we found that the apparent size of anti-PTGFRN did not change significantly throughout the gradual titration with the spent medium, see table below.
.png)
It can be concluded that the anti-PTGFRN antibody does not interact with the spent medium components and can be used for assessing binding to the exosomes even directly in crude medium.
Exosome size determination Cholesterol-TopFluor was used as an indicator for the sizing of the exosomes. In the absence of exosomes, cholesterol-TopFluor is not soluble in aqueous buffer. When added to an exosome solution, cholesterol- TopFluor can solubilise in the membrane of the exosome and thus give rise to a signal. This approach is a general tool for sizing exosomes in-solution. Here, we report a mean hydrodynamic radius (size) of 115 nm for the provided exosome solution (20% v/v spent medium). The obtained size of 115nm is in agreement with the results obtained by the anti-exosome antibody assay.
Conclusion
The FIDA technology enables straightforward sizing and affinity determinations of exosomes and exosome-ligand complexes. Furthermore, the technique has potential application for assessing exosome concentration in unknown sample. In a re- cent development, we have further improved the sensitivity and limit of quantification. For further details, please contact info@fidabio.com.
References
1. Raghu K.; Valeria S. L., The biology, function, and biomedical applications of exosomes. Science 07 Feb 2020. DOI: 10.1126/science.aau6977
2. Pedersen, M. E.; Østergaard, J.; Jensen, H., In-Solution IgG Titer Determination in Fermentation Broth Using Affibodies and Flow-Induced Dispersion Analysis. ACS Omega 2020, 5, 18, 10519–10524
3. Poulsen, N. N.; Andersen, N. Z.; Østergaard, J.; Zhuang, G.; Petersen, N.; Jensen, H., Flow Induced Dis- persion Analysis Rapidly Quantifies Proteins in Human Plasma Samples. Analyst 2015, 140, 4365- 4369.
4. Poulsen, N. N.; Pedersen, M. E.; Ostergaard, J.; Petersen, N. J.; Nielsen, C. T.; Heegaard, N. H. H.; Jensen, H., Flow-Induced Dispersion Analysis for Probing Anti- dsDNA Antibody Binding Heterogeneity in Systemic Lupus Erythematosus Patients: Toward a New Approach for Diagnosis and Patient Stratifi- cation. Anal. Chem. 2016, 88 (18), 9056-906
5. Jensen, H.; Østergaard, J., Flow Induced Dispersion Analysis Quantifies Noncovalent Interactions in Nanoliter Samples. J. Am. Chem. Soc. 2010, 132, 4070- 4071.