Robust Viscosity Measurement. Advancing Biologic formulation with FIDA Technology
INTRODUCTION
Accurate viscosity measurement is a critical parameter in the development and formulation of protein- and antibody-based therapeutics, as viscosity directly impacts manufacturability, stability, injectability, and ultimately patient experience. As biologics progress toward higher concentrations to achieve therapeutic efficacy, viscosity tends to increase sharply, creating challenges in formulation design and delivery. However, viscosity testing in this space is often complicated by the limited availability of precious protein samples during early research and development. Traditional rheological methods typically require large volumes, are time-intensive, and may not provide the sensitivity needed for highly concentrated solutions. This has driven the demand for innovative low-volume, high-precision viscosity measurement technologies that can deliver reliable insights while conserving valuable material.
technical background
FIDA viscosity measurements rely on the controlled flow of a sample through a capillary with constant inner diameter under precisely regulated temperature and pressure. For viscosity analysis, a fluorescent tracer (indicator) is injected as a small plug, enclosed within the analyte solution. As this Analyte–Indicator–Analyte segment flows through the capillary under constant pressure, the fluorescent signal is detected with a time delay relative to the start of the run.
From the point of injection to the fixed detection window (effective length: 84 cm), the analyte drives the indicator plug forward. The time taken for the maximum fluorescence intensity (highest point on the peak) to reach the detection window is termed the residence time (tR) (Figure 1).
Shifts in tR directly reflect changes in sample viscosity. A larger deviation in tR compared to a reference (e.g., water or aqueous buffer) corresponds to higher viscosity of the analyte. The FIDA software then converts the tR readout into an absolute viscosity value.
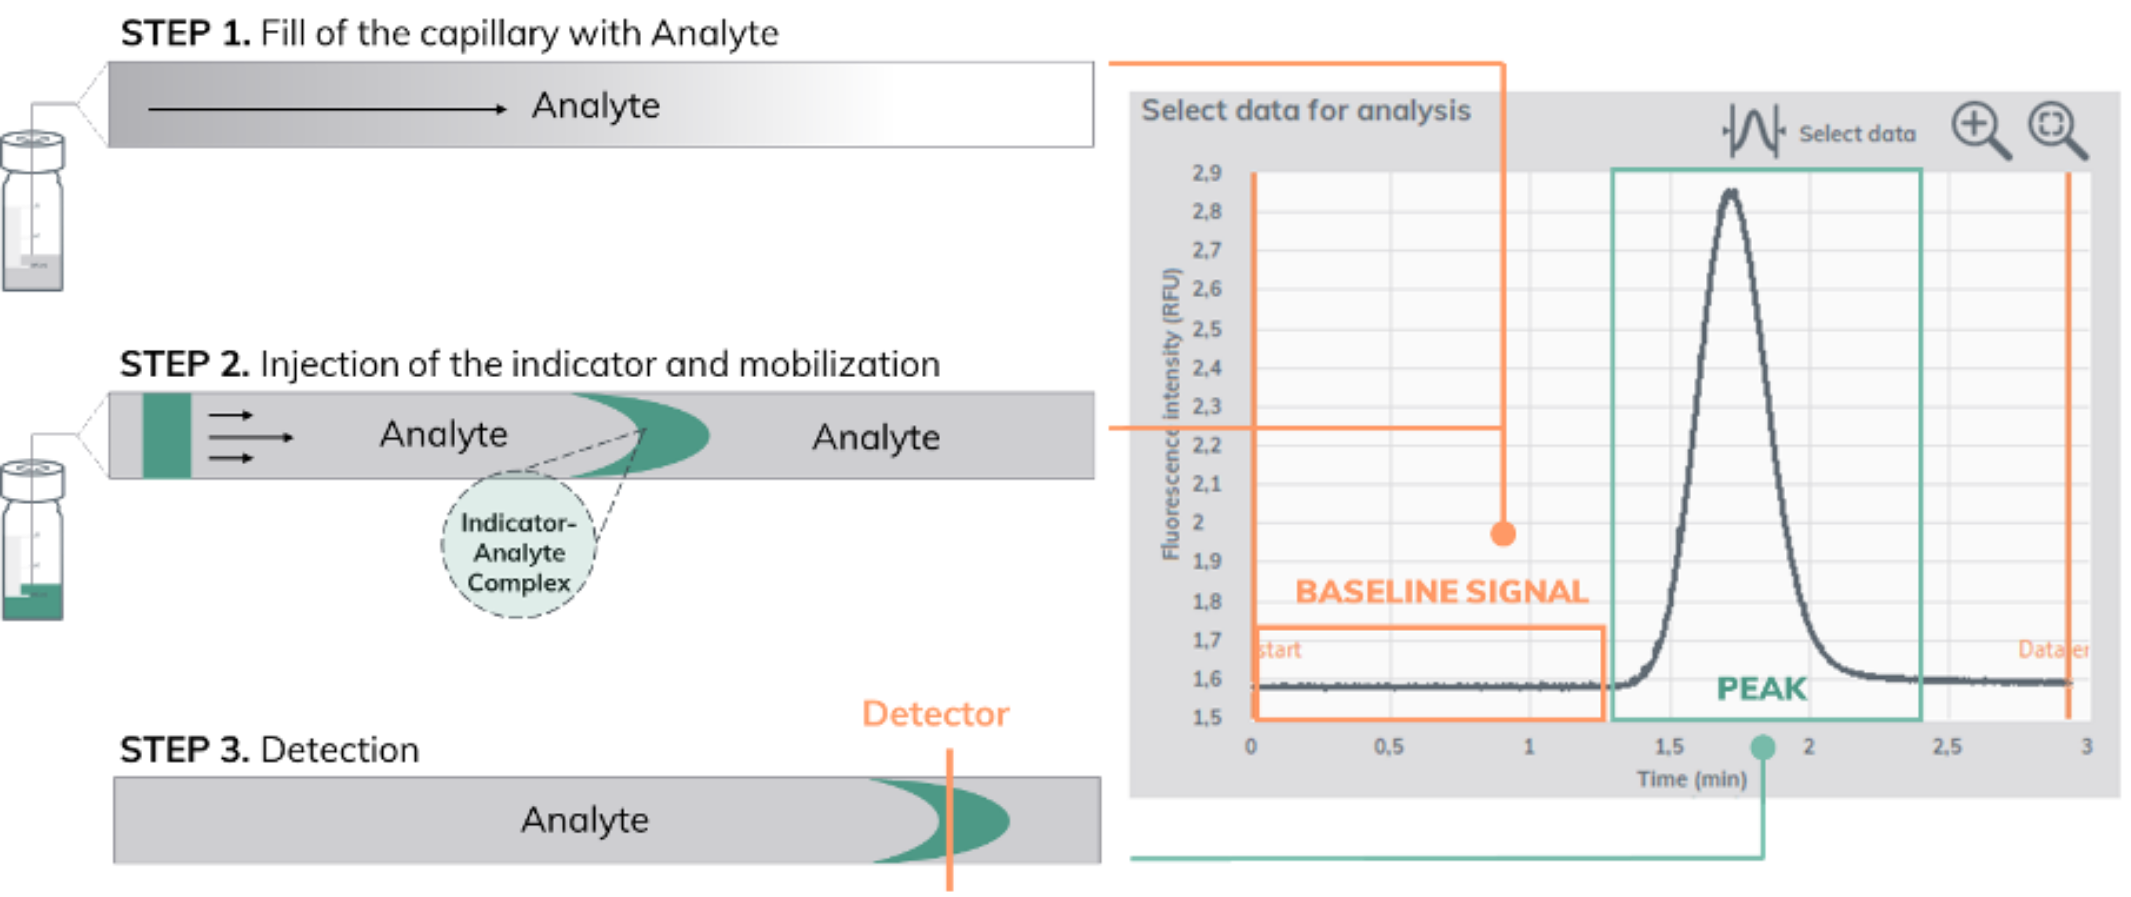
Figure 2 illustrates a batch analysis of viscosity where a set of target samples were loaded and measured in a walk-away mode. PBS was used as reference for viscosity (black peak in Fig 2). Individual peak corresponds to each sample measured and the shift or delay in time (on x-axis) relates to the viscosity of each.
.png)
Materials and methods
Viscosity measurements were performed on the Fida Neo instrument equipped with a 480 nm LED fluorescence detector. A dynamically coated capillary (length: 100 cm, inner diameter: 75 µm, effective length: 84 cm) prepared with the HS coating reagent (Fida Biosystems) was used for all experiments.
Chicken egg white lysozyme (sigma) was prepared by dissolving the lyophilized powder in 0.1 M H3PO4 at a concentration of 355 mg/ml. The protein was then subsequently diluted in 100 mM H3PO4/H2NaPO4 (NaPi buffer) pH 3.0. Fluorescein was prepared by dissolving the powder in PBS at 1 mM and diluted in NaPi buffer to the target concentration.
A 1000 nM fluorescein dye solution in sample dilution buffer served as the fluorescent tracer (indicator). The assay was conducted as a capillary mixing experiment, where the capillary was first filled with the test sample (analyte) - followed by injection of a 40 nL indicator plug-mobilization was carried out using the analyte at 2500 mbar, with capillary maintained at 25⁰C. Sample loading tray was maintained at 25⁰C throughout the run. The resulting data were processed and analyzed using the viscosity module in Fida software (version 3.2).
FIDA method used:
.png)
results
Reference measurement
.png)
The tR reference measurement was performed using the indicator molecule, i.e., 1000 nM fluorescein in NaPi. The measurement was performed at 2500 mbar mobilization pressure in the capillary mixing format, PBS-Fluorescein-PBS (Figure 3). The reference tR value of 0.24 mins was recorded.
Test measurement
.png)
Viscosity measurements were carried out using lysozyme as the model protein. Samples were prepared at concentrations up to 355 mg/mL, with serial dilutions measured across this range. For each concentration point, 50 µL of sample was dispensed into a 96-well plate (FidaBio, catalog no. 220-002), and measurements were performed in triplicate.
Data Analysis Using Fida software
To obtain the reference tR, the corresponding data point was loaded into the software interface. A single-species Gaussian fit was applied to the curve, and the resulting tR(ref) value was displayed in the “Residence Time” readout box (Figure 5–I). The obtained tR(ref) was then entered into the “tR Reference for Viscosity” field (Figure 5–II) and applied to the test data points. The calculated sample viscosity values for each data point were subsequently reported under the Generic Parameters section.
.png)
Batch processing of datasets was performed using the ‘Autoanalysis’ mode in the Fida software. The resulting analyses were published on the built-in QC dashboard, where users can configure export options as needed (Figure 6). In this case, species information and generic parameters were exported in both PDF and CSV formats.
.png)
The obtained viscosity values were plotted as a function of lysozyme concentration, revealing an exponential increase in viscosity up to approximately 280 mg/mL. As illustrated in Figure 7, a deviation from this exponential trend is observed at higher concentrations, where the viscosity increase becomes non-exponential.
.png)
FIDA in Biologics Production Worklow
.png)
Conclusion
In this appnote we have presented the implementation of FIDA technology in viscosity determination. The method is fully autonomous and can be used to perform batch measurements in a 96-well format. Here, Fida Instrument (Fida Neo) offers several advantages over a broad range of aspects like -
- Thermal control – Accurate temperature regulation between 10–55 °C in the measurement chamber enables viscosity measurements under optimal conditions.
- Auto-sampling – Samples loaded onto the FidaNeo instrument are analyzed in a fully automated, walk-away manner.
- Low sample consumption – Each measurement requires only a few microliters of test sample, minimizing material use and reducing overall product development costs.
- High efficiency – Automated viscosity measurements eliminate manual handling, freeing operators to focus on other tasks and improving overall productivity.