
Screening conformational stability using only nanograms of protein
INTRODUCTION
The conformational stability of therapeutic proteins is key to biological function, efficacy, and safety¹˒² . Hence, substantial effort is diverted into formulation studies during drug development to identify the optimal conditions for maintaining stability of these fragile entities¹˒² . Protein stability is typically assessed by analytical methodologies measuring relative changes in optical properties such as fluorescence or scattering upon thermal or chemical perturbation. Contrarily, Fida 1 provides an absolute measure of hydrodynamic radius (Rₕ) and intrinsic fluorescence of proteins during in-line denaturation with guanidinium chloride (GuHCl). Assessing chemical denaturation is a valuable supplement to thermal denaturation as it provides a quantitative thermodynamic readout of protein stability at a well-defined temperature. In this work, we demonstrate how the Fida 1 can be utilized for probing conformational stability of the therapeutic antibody adalimumab using as little as 39 ng per measurement. We report Cₘ-values and the free energy of unfolding for adalimumab at different pH values. The Fida 1 is ideal for assessing stability during drug development or when having scarce amounts of sample available.
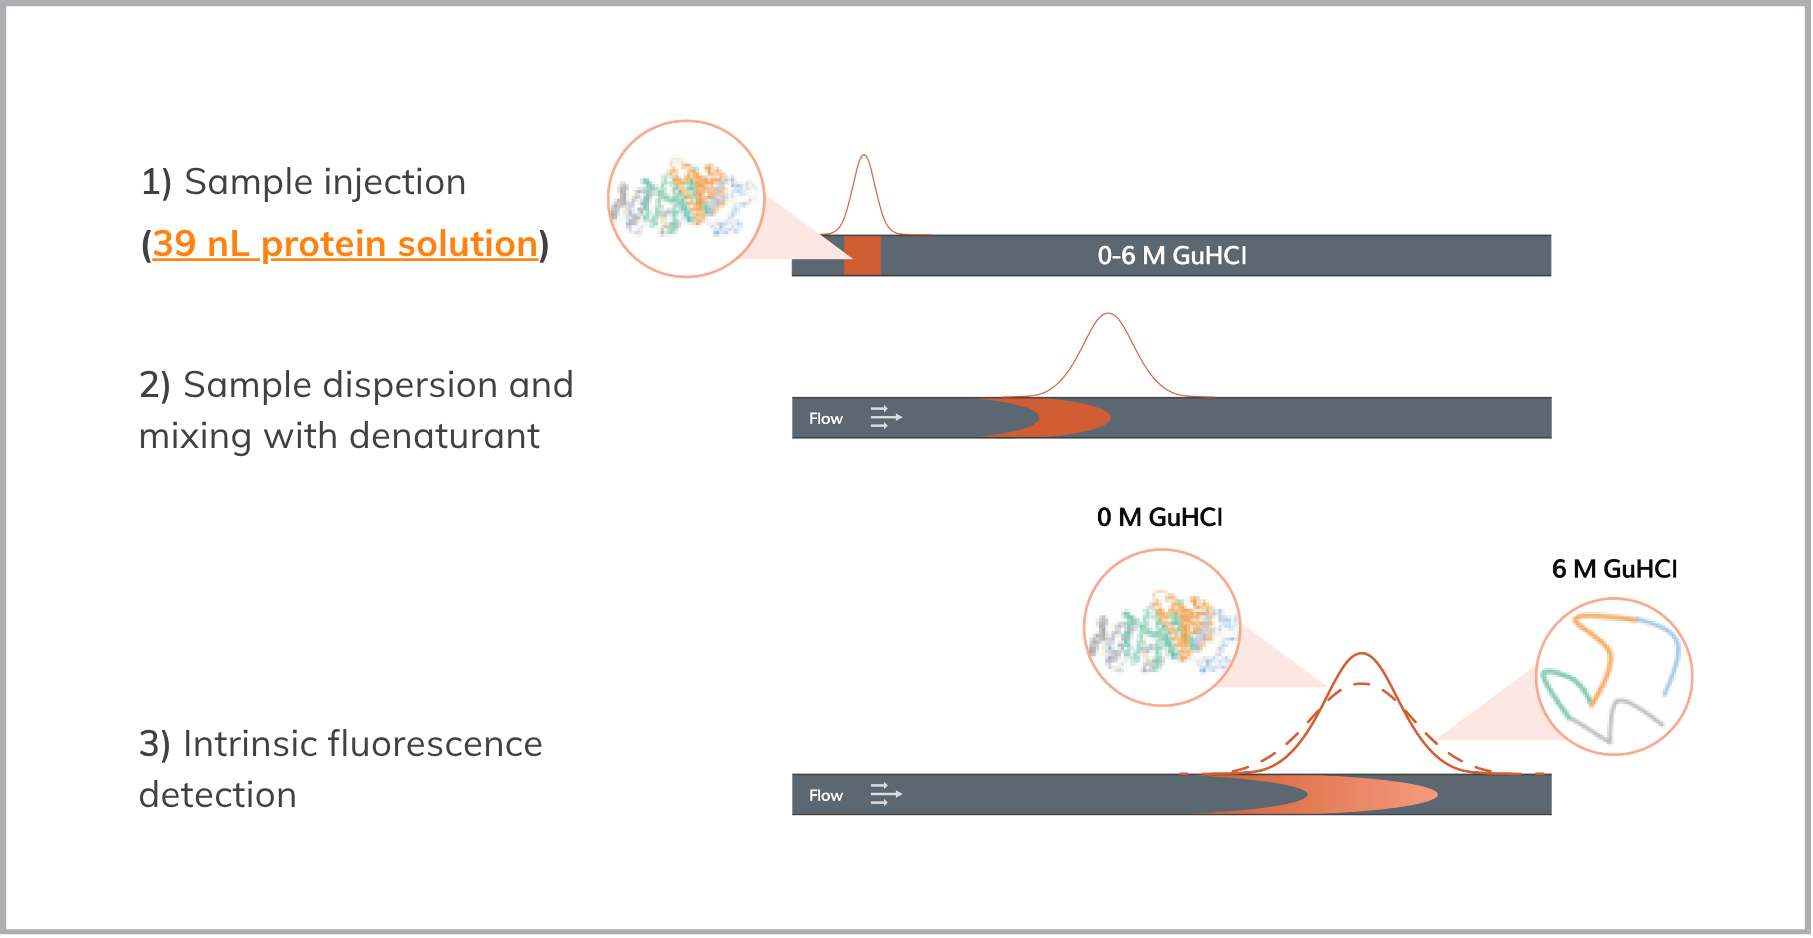
FIDA principle
Flow Induced Dispersion Analysis (FIDA) is a capillary-based methodology for studying biomolecular stability, interactions, size (Rₕ), and analyte concentration etc³˒⁴. It is a “first principle” technology building on the fact that the flow rate in the center of a capillary is faster than at the edges³˒⁴.
The resulting dispersion profile inside the capillary is a product of both radial molecular diffusion and flow rate. Consequently, the molecular diffusion coefficient can be precisely determined and translated into a hydrodynamic radius (Rₕ) using the Stokes-Einstein equation³˒⁴. In this work, both intrinsic fluorescence and hydrodynamic radii of proteins undergoing chemical denaturation are obtained in a single measurement. To learn more, visit fidabio.com.
Material & Methods
Experiments were performed on a Fida 1 instrument employing 280 nm LED-UV fluorescence detection using a high-sensitivity coated capillary (Fida Biosystems). The hydrodynamic radii and intrinsic fluorescence of adalimumab were measured as a function of denaturant concentration (GuHCl, 0-6 M) at pH 4.0, 7.0, and 10.0. Each data point consumed only 39 ng of protein sample with an analysis time of 6 min. The assay buffer was 20 mM HEPES, 20 mM histidine-HCl, and 20 mM sodium succinate following pH-adjustment with NaOH or HCl. Data analysis was conducted utilizing the Fida software (V 2.3).
Results
Adalimumab showed an increase in hydrodynamic radius (Rₕ) from 5.0 nm to 7.5 nm, accompanied with changes in intrinsic fluorescence (Figure 2) upon in-line denaturation with GuHCl. This was as expected since adalimumab transitions from a globular folded structure to an unfolded state. The increase in adalimumab fluorescence emission can be ascribed to tryptophan and tyrosine quenching within the folded structure. Quantitative stability assessment and condition ranking of adalimumab was conducted by applying the Fidabio unfolding model (Figure 2).
The results are summarized in Table 1 which revealed that adalimumab was least stable at pH 4 while pH 7 and 10 demonstrated similar stability. The standard free energy change, ΔG° (H₂O), defines conformational stability in the absence of denaturant at certain conditions including pH, ionic strength, and temperature. The Cₘ-value reflects the denaturant concentration with equal fractions of native and denatured protein. Conditions favouring high conformational stability results in both high ΔG° and Cₘ values. In all, this work demonstrates the applicability of the Fida 1 for straightforward condition screening of proteins.
.png)
.png)
Conclusions
The Fida 1 provides automated assessment of protein stability utilizing two concurrent readouts namely protein size (Rₕ) and intrinsic fluorescence intensity. The developed method relies on truly label-free measurements using a few ng of sample, combined with an automated workflow that takes care of the tedious denaturant mixing procedure. In all, with its ability to report Cₘ and ΔG° values from the resulting unfolding curves makes it ideal for early drug development where sample amounts are precious as well as in formulation screening studies.
References
1. Robinson, C. J.; Jones, C. Quality Control and Analytical Techniques for Biopharmaceuticals. Bio- analysis 2011, 3 (1), 81–95.
2. Filipe, V.; Hawe, A.; Carpenter, J. F.; Jiskoot, W. Analytical Approaches to Assess the Degradation of Therapeutic Proteins. TrAC - Trends Anal. Chem. 2013, 49, 118–125.
3. Pedersen, ME; Gad, SI; Østergaard, J; Jensen, H. Protein Characterization in 3D: Size, Folding and Functional Assessment in a Unified Approach. Anal. Chem., 2019, 91 (8), 4975-4579.
4. Pedersen, ME; Haegebaert, RMS; Østergaard, J; Jensen, H. Size-Based Characterization of Adalimumab and TNF-α Interactions Using Flow Induced Dispersion Analysis: Assessment of Avidity Stabilized Multiple Bound Species. Sci. Rep., 2021, 11 (1), 1-10.