
Size-based characterization of peptide-liposome interactions
Introduction
The present application is based on a paper published in 2020 (1).
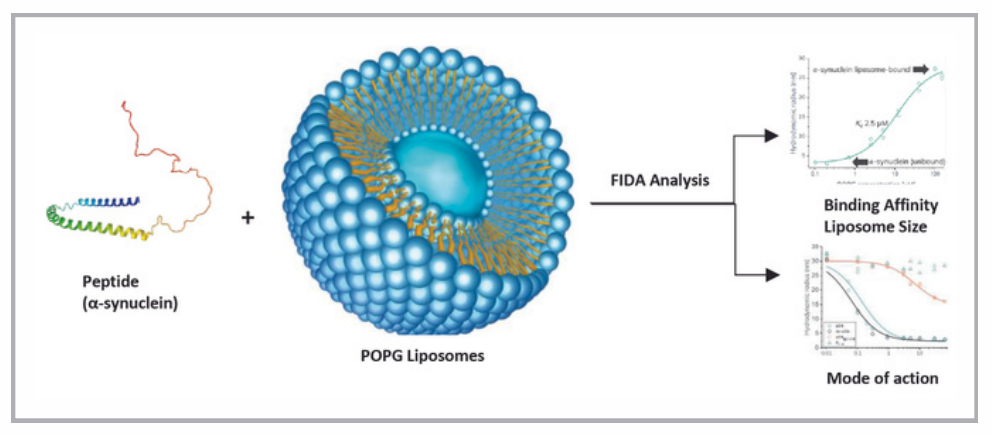
Liposomes are vesicles mimicking the structure of cell membranes, thereby being ideal for studying complex membrane interactions in-vitro. In the present work, POPG liposomes are used as a model system of the neuronal cell membrane to study the interaction with α-synuclein (αSN), a small peptide (140 aa) involved in many neurodegenerative diseases.
Usually, detailed characterization of membrane interactions requires an array of different analytical methodologies for obtaining very little information. In this work, we present Flow Induced Dispersion Analysis (FIDA) for size-based characterization of the interaction between α synuclein and POPG liposomes, revealing binding affinity (Kd), liposome size and interaction mechanism (1). FIDA is a new capillary-based technology for measuring binding affinity and complex size of biomolecules in-solution under native conditions (2-5). FIDA utilises Taylor dispersion for accurate size determinations of analytes in a pressure-driven flow (2).
Material & Methods
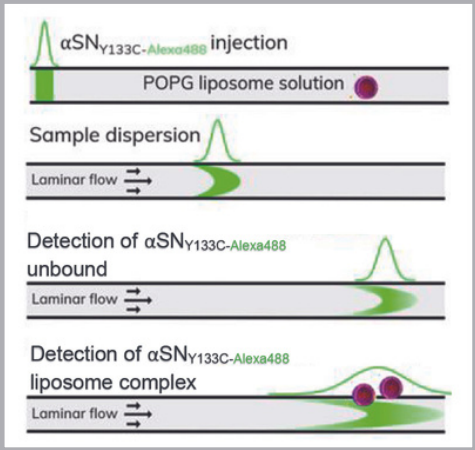
The experiments were conducted on a Fida 1 instrument employing 488 nm laser induced fluorescence detection, using Fida standard capillaries (i.d.: 75 μm, L : 100 cm, L eff: 84 cm). Sample analysis was performed by filling the capillary with 4 μL of POPG liposome solution, followed by injection of 40 nL αSNY133C-Alexa488 pre-incubated with POPG liposome, which was then mobilised towards the detector with the POPG liposome solution at 100 mbar for 10 min at 21 °C, pH 7.4.
The affinity measurement was performed at a fixed concentration of αSN Y133C-Alexa488 (200 nM) titrated against varying concentrations of POPG liposomes (0-200 μM). For the competitive assay, the competitor was added in varying concentrations to a fixed concentration of the αSN Y133C-Alexa488 – liposome complex.
Data analysis was performed using the dedicated Fida software.
Results
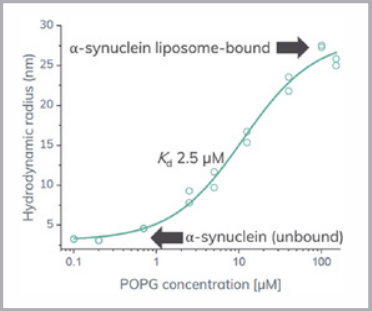
Binding affinity and liposome size. The FIDA technology provides an absolute measurement of molecular size (i.e. hydrodynamic radius) for a selective binder (αSN) as it interacts with the analyte of interest (POPG liposomes). In this work, it was found that the hydrodynamic radius of free αSN was 3.2 nm, which is in line with hydrodynamic radii found in the literature (6). The apparent size of αSN increased steadily with increasing POPG concentrations, up to ~27 nm, clearly demonstrating an interaction with a much larger particle (Figure 3). The data points were fitted to the FIDA binding isotherm and the dissociation constant (Kd) of the interaction was found to be 2.5 μM, assuming 1:1 binding stoichiometry. Furthermore, the complex size was calculated to be 28.5 nm, thereby revealing the mean radius of the POPG liposomes.
Mode Of Action
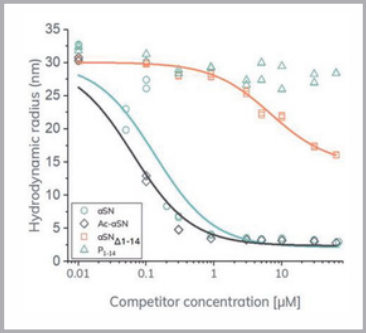
The mode of action was assessed by an array of competitive FIDA assays, where four different analogs of αSN were tested with the previously developed assay (Figure 3). In detail, the fully bound complex was selected as the initial state (100 μM POPG, 0.2 μM αSN), and thed isplacement abilities of the αSN analogs were measured in titration experiments for obtaining IC₅₀ values. Here, we found that wildtype αSN (blue line) and the N-acetylated-αSN (black line) were able to fully displace the liposome-bound αSN (Figure 4). The inhibition concentrations (IC₅₀) were calculated from the FIDA binding isotherm to be 0.3 μM and 0.5 μM for the Nacetylated-αSN and wildtype αSN respectively; comparable to the indicator concentration (αSN) of 0.2 μM.
However, the analog αSNΔ₁-₁₄ (orange line), with N-terminal deletion of the first 14 amino acids, was not able to fully displace the liposome-bound αSN. Furthermore, the apparent affinity was significantly impaired, seen as a shift of several orders of magnitude. Finally, the deleted N-terminal fragment, P₁-₁₄, could not displace the liposome-bound αSN at all, observed as a steady size throughout the titration (blue triangles). In conclusion, the preservation of the N-terminal residues 1-14 is crucial for membrane interaction. However, the N-terminal residues alone cannot engage with the liposome membrane, thereby indicating a complex mode of action depending on avidity.
Conclusion
FIDA was used for in-solution characterization of the interaction between αSN and POPG liposomes, precisely reporting binding affinity (Kd), absolute complex size and mode of action. This protocol can easily be transferred to other vesicles, such as exosomes. Finally, FIDA have many advantages over traditional methodologies, including low sample consumption (few μL), fully automated platform, absolute size measurements, built-in quality control, and in-solution assays.
References
1. Cholak, E. et al, Avidity within the N-terminal anchor drives α-synuclein membrane interaction and insertion. FASEB J. 2020, 34 (6), 7462-7482.
2. Jensen, H.; Østergaard, J., Flow Induced Dispersion Analysis Quantifies Noncovalent Interactions in Nanoliter Samples. J. Am. Chem. Soc. 2010, 132, 4070-4071.
3. Poulsen, N. N.; Andersen, N. Z.; Østergaard, J.; Zhuang, G.; Petersen, N.; Jensen, H., Flow Induced Dis- persion Analysis Rapidly Quantifies Proteins in Human Plasma Samples. Analyst 2015, 140, 4365-4369.
4. Poulsen, N. N.; Pedersen, M. E.; Ostergaard, J.; Petersen, N. J.; Nielsen, C. T.; Heegaard, N. H. H.; Jensen, H., Flow-Induced Dispersion Analysis for Probing Anti-dsDNA Antibody Binding Heterogeneity in Systemic Lupus Erythematosus Patients: Toward a New Approach for Diagnosis and Patient Stratification. Anal. Chem. 2016, 88 (18), 9056-9061.
5. Pedersen, M.E.; Gad, S.I.; Østergaard, J.; Jensen, H., Protein characterization in 3D: size, folding and functional assessment in a unified approach. Anal. Chem. 2019, 91, 4975-4979
6. Sangeeta, N. et al, Early Aggregation Steps in a-Synuclein as Measured by FCS and FRET:Evidence for a Contagious Conformational Change. Biophys J. 2010, 98 (7), 1302-1311