
Exploring Small Molecule Interactions with Membrane Proteins Using Fida
INTRODUCTION
Understanding the intricate interactions between small molecules and membrane proteins is pivotal for deciphering their biological functions and facilitating the development of drugs targeting integral membrane proteins. However, characterizing these interactions in vitro presents a signifi cant challenge, primarily due to the subtle mass changes between the ligand-free and bound states of membrane proteins. This proves an obstacle for methods relying on a change in molecular mass for detection of complex formation such as surface plasmon resonance, biolayer interferometry, mass photometry, analytical ultracentrifugation, and microscale thermophoresis. To circumvent this, one can turn to thermodynamics and employ isothermal titration calorimetry. However, this approach is marred by high sample consumption, exacerbating the difficulty of producing substantial quantities of stable, monodisperse membrane proteins.
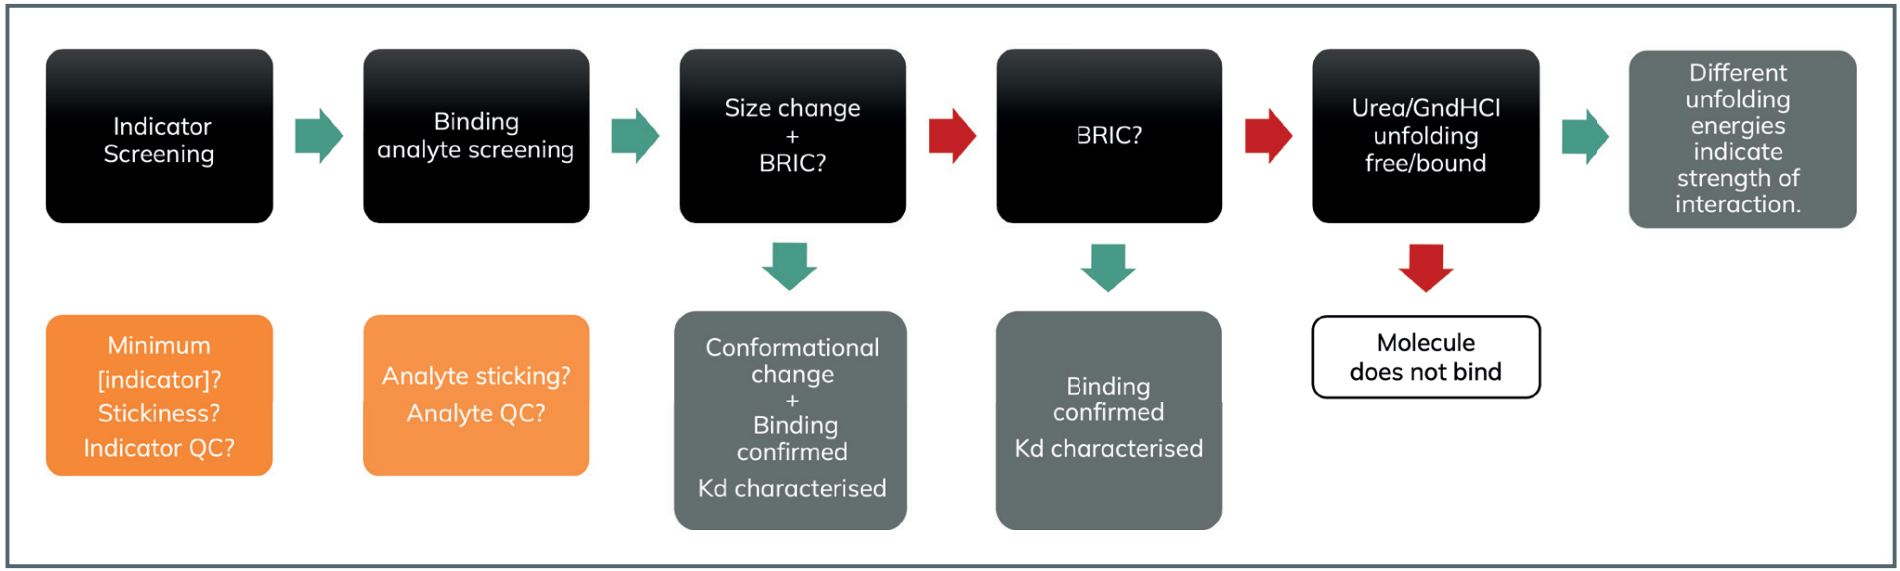
In this application note, we outline the approach to study interactions between small molecules and membrane proteins using Flow Induced Dispersion Analysis (FIDA). It is covered, how to interpret the dual readouts of changes in hydrodynamic radius (fi g 1b) and Binding Related Intensity Changes (BRIC, fi g 1c), how full titration curves can be generated using only a few µL of membrane protein (Figure 1a) and how to completely rule out an interaction if there is no BRIC and no size change upon mixing.
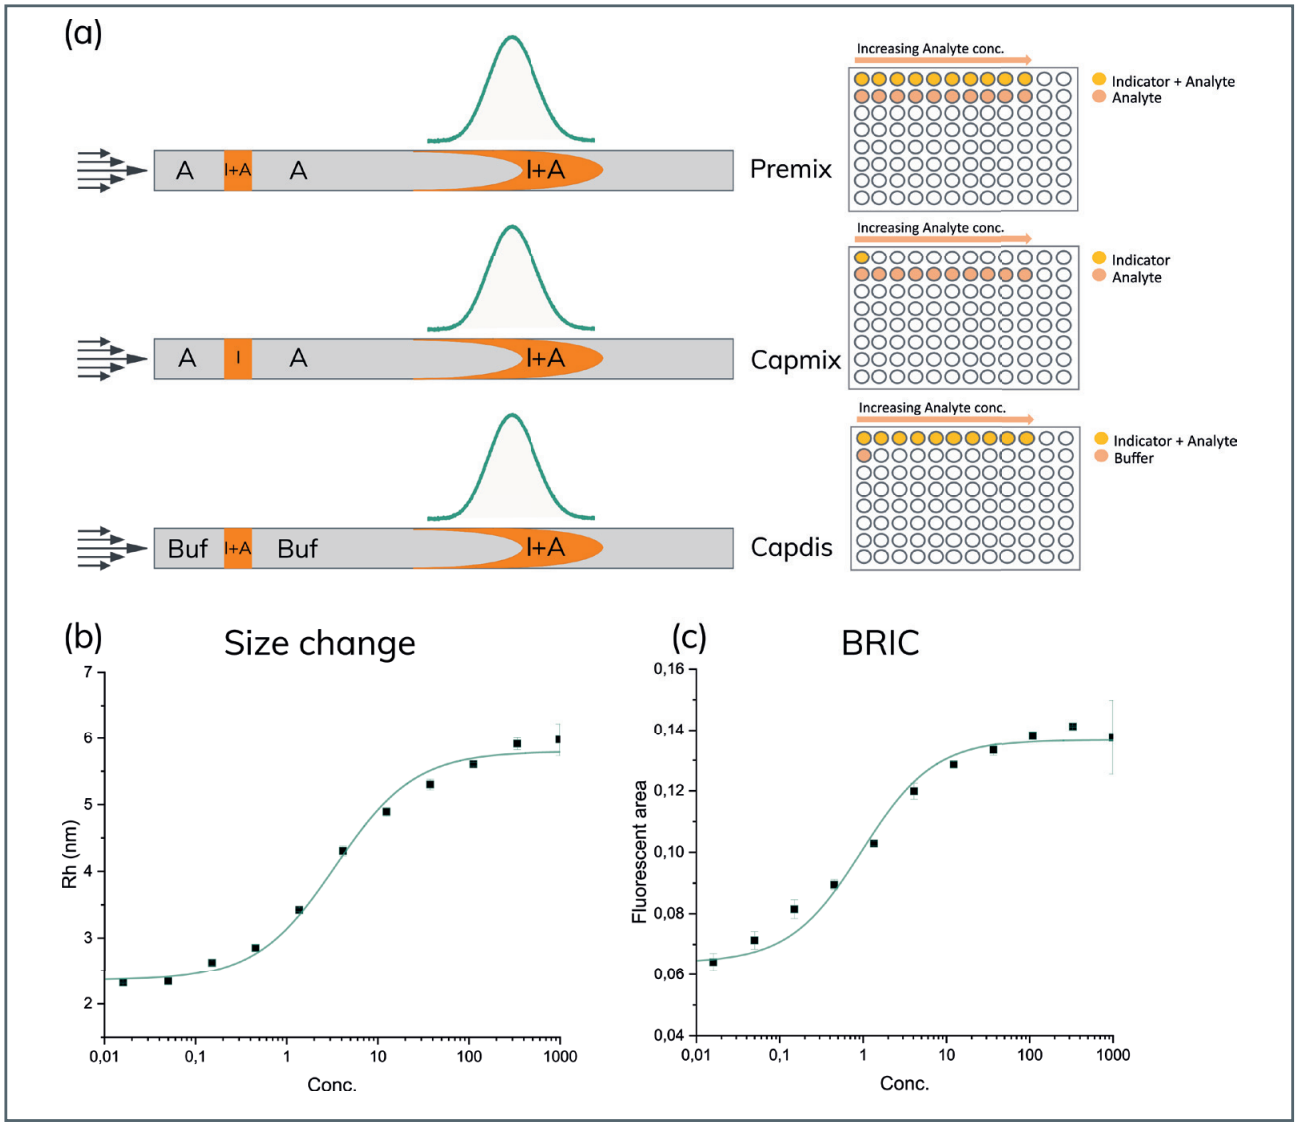
(a) A description of premix, capmix and capdis and the plate layout for each method. The different methods do not require any change to the instrument setup.
(b) A titration curve with a size change
(c) A titration curve with increasing BRIC.
MATERIALS AND METHODS
The assays were performed on a Fida 1 equipped with a 275 nm LED fl uorescence detector and a FIDA PC capillary (L: 1 m, ID: 75 µm, Leff: 84 cm). The detector picks up emission light with a wavelength greater than 300 nm. The sample tray was kept at 5 °C during the entire run and the capillary chamber was set to 10 °C. All experiments were performed in the capillary mixture (capmix) mode, reducing the membrane protein sample consumption to 1.44 µL per titration curve. The indicator was a detergent solubilized membrane protein at 0.8 g/L, assayed in buffer X containing detergent Y (details to be disclosed upon peer reviewed publication). The analyte used was buffer X containing the assayed small molecules at concentrations ranging from 0-500 mM or urea at concentrations ranging from 0-7.2 M. The mobilization pressure was 400 mbar.
RESULTS
To demonstrate how small molecule interactions can be characterized by FIDA 1, three cases are examined. One where there is both a change in size and a BRIC upon interaction with the small molecule, a second where there is only a BRIC, and a third where we validate whether there is an interaction when there is no size change or BRIC.
Case 1: A change in fluorescence and size
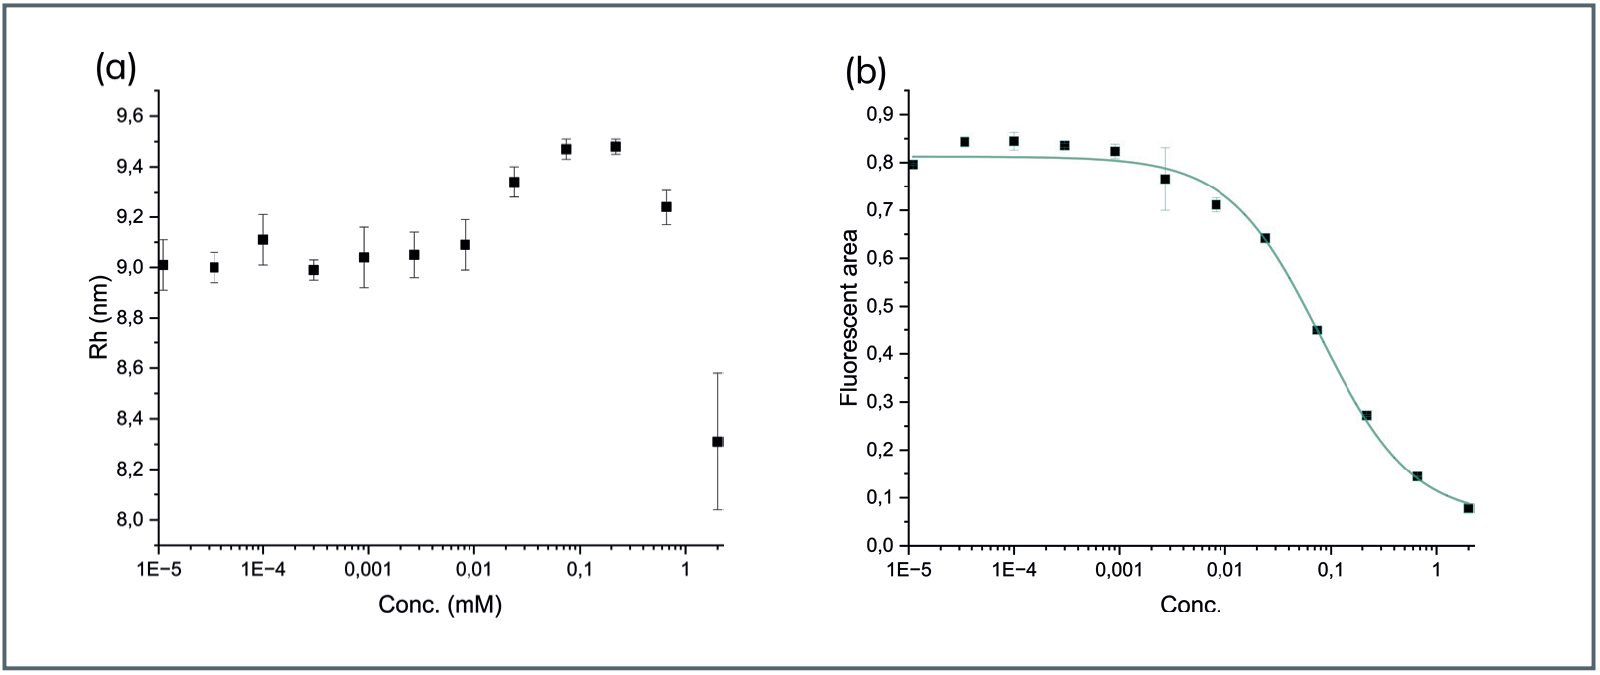
A detergent solubilized integral membrane protein was used as indicator and titrated against a small molecule as a capmix assay (fi g 1a). The total sample consumption of membrane protein for this titration was 1.44 µL. A clear BRIC is observed, and a standard 1-1 model can be fitted to it (Figure 2b). The information revealed by plotting the hydrodynamic radius as function of ligand concentration shows a remarkable pattern (Figure 2a). There is an initial increase corresponding to a size of 0.5 nm plateauing at half the BRIC observed. This indicates that the membrane protein adopts a more extended conformation than at the start of the titration. After this point there is a collapse of 1.2 nm indicating that the membrane protein goes from an extended conformation to a collapsed form in the saturated complex. One possible explanation could be that the protein has two binding sites for the small molecule. This highlights the added benefit of characterizing small molecule-membrane protein interactions with Fida as not only can you observe changes in fluorescence in nL samples but also gain insight into conformational structural changes because of the interaction.
Case 2: A change in fluorescence but not in size.
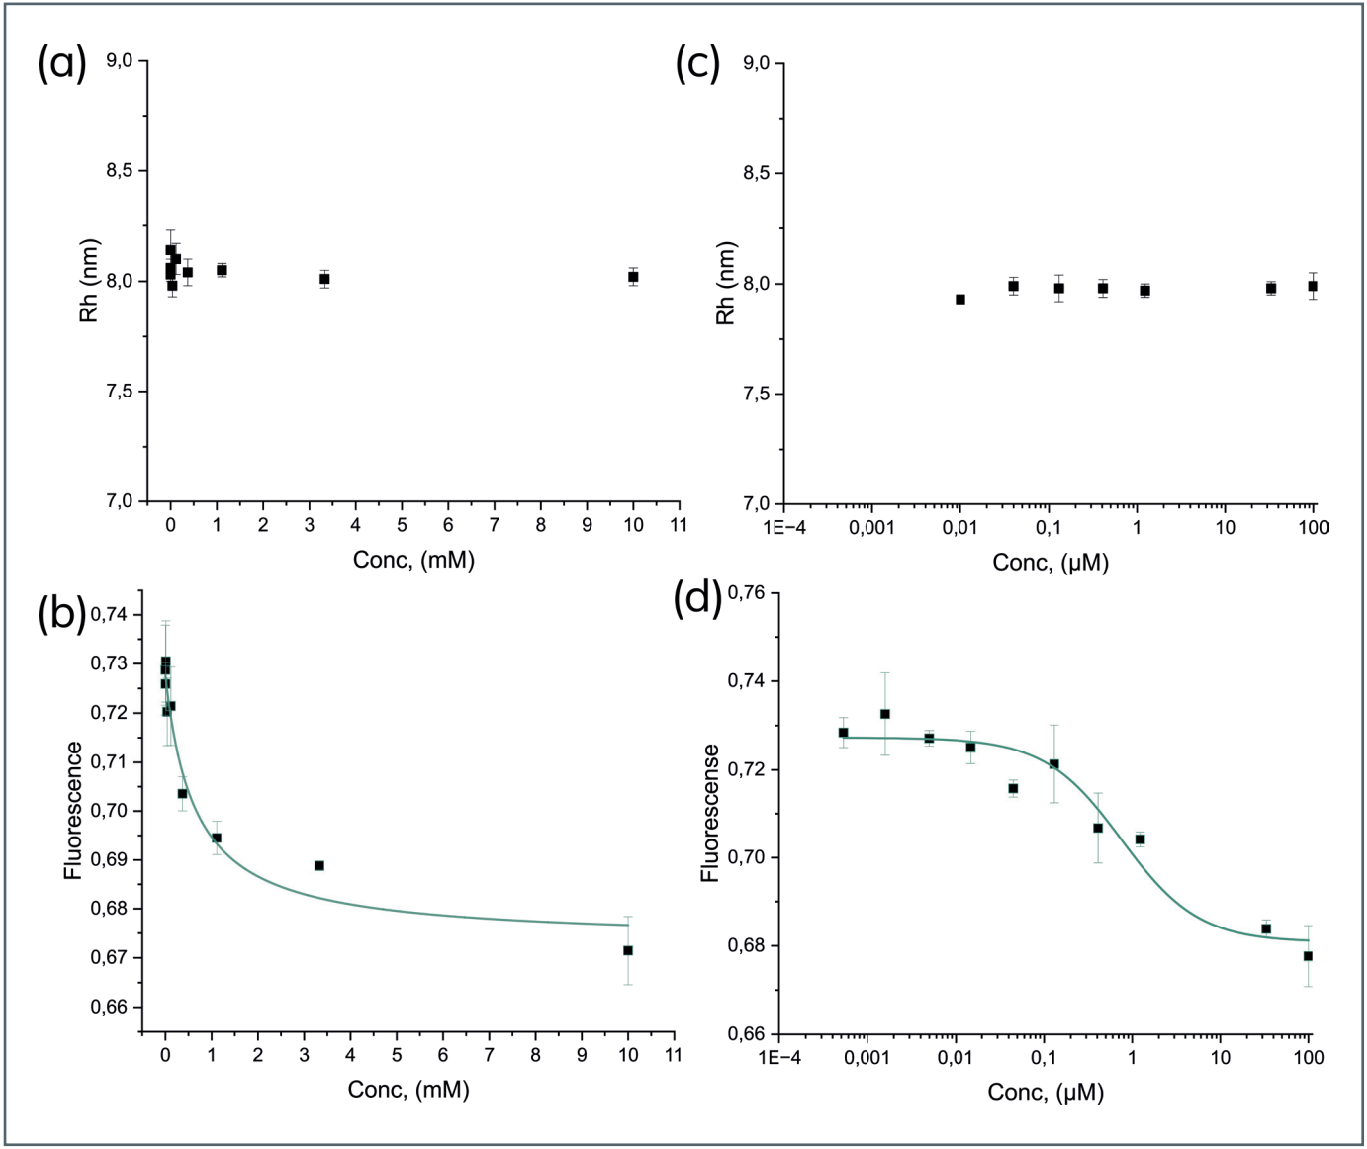
In Case 1 where both a change in the conformational state of the protein and a BRIC occurs, evaluation of binding is relatively straight forward. However, there are cases in which binding a small molecule to a membrane protein causes little to no conformational changes. In such a case the tryptophan emission may still be impacted by binding and can be followed by the BRIC. Two such examples are shown in Figure 3. The first example shows a membrane protein binding to a small molecule with a relatively weak affinity, requiring mM concentration to reach saturation. After viscosity correction of sizes, no change in size is observed (Figure 3a). However, there is a clear impact on the BRIC indicating interaction which can be modelled with a simple 1-1 binding model (Figure 3b). An example with a stronger interaction can be seen in Figure 3c and d. Again, there is no change in the viscosity corrected hydrodynamic radius (Figure 3c) but when the BRIC is plotted a clear concentration dependent decrease is observed indicating binding.
Case 3: No change in size or fluorescence
If a small molecule is added to the membrane protein and no change in size nor BRIC is observed, one might reasonably assume that no interaction occurs. However, it is possible that the small molecule is interacting with the membrane protein in a position that does not cause a conformational change and where there is no nearby tryptophan. However, such an interaction should change the energy of folding of the protein. The energy of folding of the membrane protein can be determined by titrating the membrane protein in the presence and absence of the small molecule with either urea or guanidinium hydrochloride. Such a titration performed as a capmix will only consume approximately 1.5 µL of the membrane protein. An example of this can be seen in Figure 4.
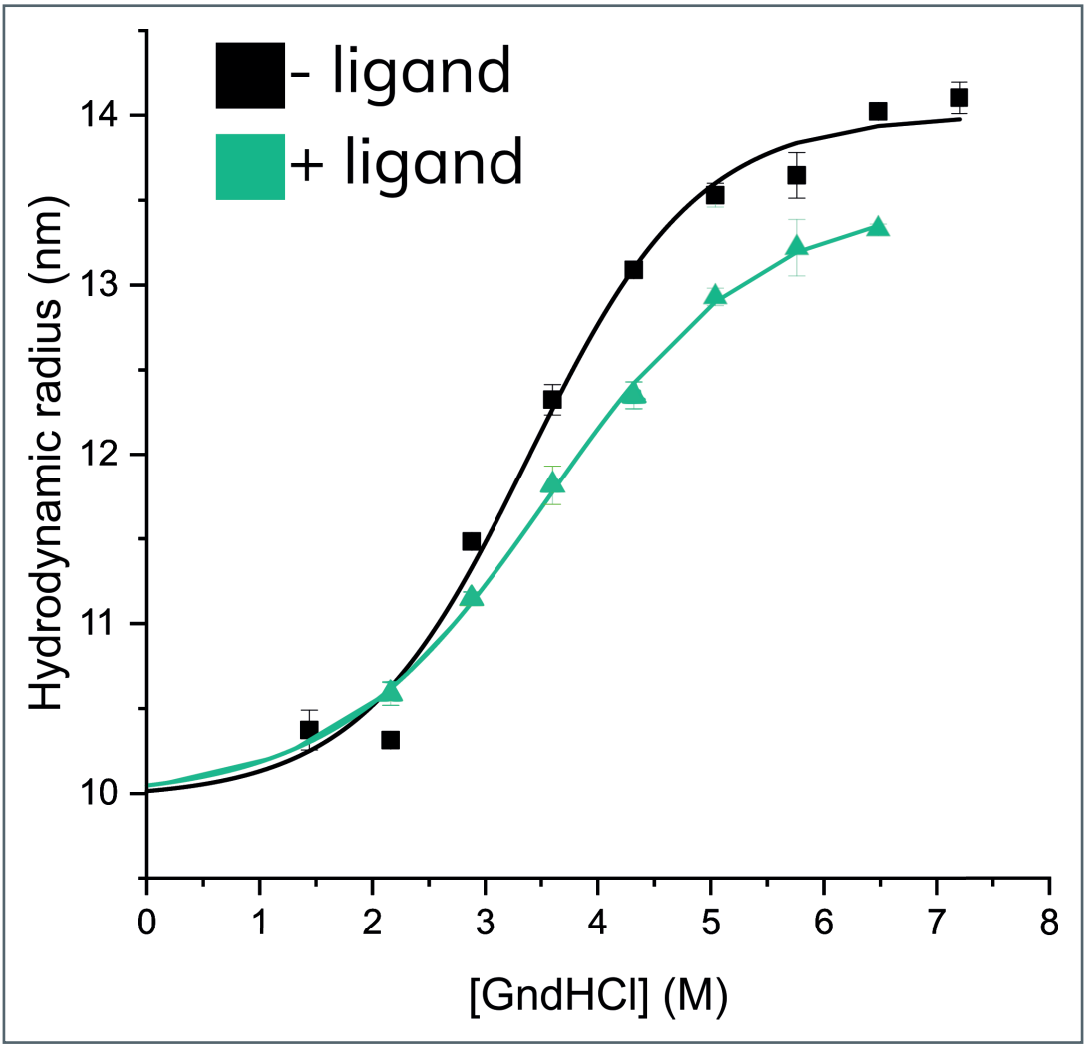
The slope of the unfolding curve, i.e., the m-value, changes from 0.75 to 0.61 kcal/(mol×M). The m-value correlates with the amount of protein surface exposed upon unfolding (Myers et al., 1995) indicating that the protein has compacted in the presence of the small molecule without it being measurable. Further supporting the interaction is also the change in free energy of folding from ΔG = 2.4 kcal/mol without the ligand compared to ΔG = 2.0 kcal/mol with the ligand.
CONCLUSION
Fida can be used to characterize small molecule interactions with membrane proteins. The added benefit compared to conventional technologies is the additional information on conformational change of the membrane protein upon binding the ligand as well as the capability to perform full titration curves consuming only microliters of the membrane protein sample.
REFERENCES
Myers, J. K., Pace, C. N., Scholtz, J. M., & Scholtz, M. (1995). m values and heat capacity changes: Relation to changes in accessible surface areas of protein unfolding. In Protein Science (Vol. 4). Cambridge University Press.