
The Relationship between hydrodynamic radius and molecular weight
INTRODUCTION
Molecular weight and molecular geometry are the two most commonly used first principle properties to characterize biomolecules.
Molecular geometry can be described by the hydrodynamic radius (nm), which is the size of a particle or molecule in a fluid, taking into account its shape, mass, and interactions with the surrounding fluid molecules. The hydrodynamic radius is defined as the radius of a hypothetical sphere that diffuses at the same rate as the particle or molecule in question, under the same conditions (Einstein, 1905).
The hydrodynamic radius is used to describe the behavior of biomolecules, such as proteins, in solution. Techniques such as dynamic light scattering (DLS), size exclusion chromatography (SEC), SEC-MALLS, analytical ultracentrifugation (AU), or flow-induced dispersion analysis (FIDA) are used to determine the hydrodynamic radius experimentally. The hydrodynamic radius is a crucial parameter in drug discovery, biotechnology, and environmental science, where the behavior of molecules in solution is essential to their function and properties.
In contrast, molecular weight (kDa) is the sum of the atomic weights of all atoms in a molecule, and it can be used to determine oligomerization, complex formation, and post-translational modifications. It is typically measured by techniques such as mass spectrometry or mass photometry. In general, larger molecules tend to have higher molecular masses than smaller molecules, but the relationship between molecular weight and size is not always straightforward.
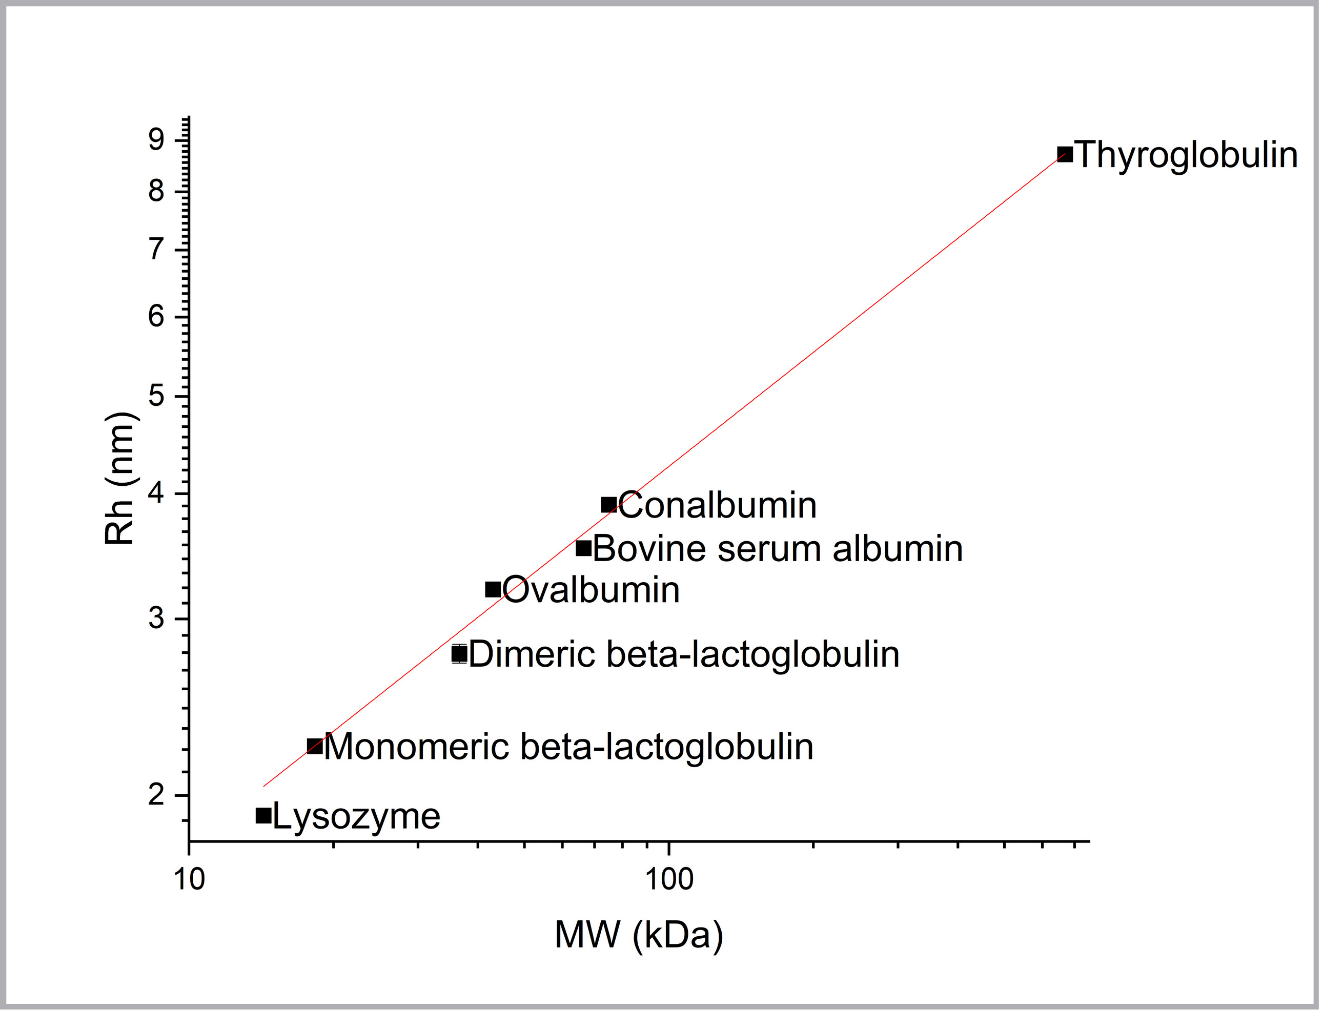
For classical methods such as SEC, the molecular size is reported as molecular weight, with the unit kDa. The conversion from hydrodynamic radius to molecular weight is done by running globular proteins of known mass and plotting the retention time versus the molecular weight on a double logarithmic plot as a calibration curve. However, this method assumes that all proteins are globular, which is not always the case. A similar trendline can be drawn for a given conformational state of a protein (molten globule, pre-molten globule, coil-like, and unfolded), which can be used to characterize the overall structural properties of proteins more accurately (O’Shea et al., 2015; Uversky, 2002).
This technote reports a similar mass calibration experiment by running globular proteins of known molecular weight on the Fida 1 using label-free detection with the 280 nm excitation detector.
Materials & Methods
Fida 1 equipped with a 275 nm LED fluorescence detector. A FIDA dynamic coated capillary (L: 1 m, ID: 75 µm, Leff: 84 cm). The buffer used was PBS for all experiments. Indicator concentration was 1-5 g/L protein. The experiment was run as a capillary dissociation experiment with the capillary filled with buffer, then a 40 nL injection of sample and mobilization with analyte. The experiments were performed as technical triplicates and the data was analysed using Fida Software V2.34 with a standard fit to the raw data. The standard proteins run were either directly procured from Sigma Aldrich or from the Cytiva gel filtration calibration kit.
Results
The hydrodynamic radius of the standard proteins was measured in triplicate at 25°C and plotted against their molecular weight on a double logarithmic plot (figure 1). As expected, a linear trend was observed, which can be used to calibrate the conversion of hydrodynamic radius into molecular weight (table 1). However, this calibration curve only applies to globular proteins.
To demonstrate this, BSA and beta-lactoglobulin were run in a high concentration of GndHCl, which should unfold the proteins (Figure 2). A significantly larger hydrodynamic radius was observed, and a similar trendline was drawn to describe unfolded proteins, as previously described by Uversky et al. (O’Shea et al., 2015; Uversky, 2002).
.png)
The resulting plot reveals three general zones when plotting the hydrodynamic radius of your proteins against their molecular weight (figure 2). The orange zone represents proteins whose hydrodynamic radius exceeds that of the completely unfolded monomer, indicating oligomerization. The green zone represents proteins whose hydrodynamic radius is larger than that of a globular protein of the same mass. This can be caused by an elongated structure, disordered regions, or protein oligomerization, which can be determined from additional FIDA experiments. Lastly, the red zone represents proteins whose hydrodynamic radius is apparently smaller than the most compact form of the polypeptide, indicating either protein degradation or the loss of a subunit. This information is revealed through the QC parameters measured by FIDA.
To demonstrate this, BSA was boiled in a low ionic strength tris buffer, causing oligomerization. Clear evidence of higher order oligomers was observed, as the final hydrodynamic radius was greater than the unfolded protein trendline (figure 2). Conversely, when partially degraded aldolase and ferritin were characterized, both fell below the expected line and showed clear indications of degradation issues, such as the presence of multiple species and aggregates.
conclusion
In this technote the relationship between hydrodynamic radius and molecular weight was explained. A standard curve of globular proteins was recorded which can be used to convert hydrodynamic radius to molecular weight (table 1). Furthermore, it was demonstrated how to record the unfolded protein line (table 2) allowing for a plot to quickly visualize and identify structural properties of your protein sample.
.png)
.png)
References
Einstein, A. (1905). Über die von der molekularkinetischen Theorie der Wärme geforderte Bewegung von in ruhenden Flüssigkeiten suspendierten Teilchen. Annalen Der Physik, 322(8), 549–560. https://doi.org/10.1002/andp.19053220806
O’Shea, C., Kryger, M., Stender, E. G. P., Kragelund, B. B., Willemoës, M., & Skriver, K. (2015). Protein intrinsic disorder in Arabidopsis NAC transcription factors: Transcriptional activation by ANAC013 and ANAC046 and their interactions with RCD1. Biochemical Journal, 465, 281–294. https://doi.org/10.1042/BJ20141045
Uversky, V. N. (2002). Natively unfolded proteins: A point where biology waits for physics. Protein Science, 11(4), 739–756. https://doi.org/10.1110/ps.4210102