.png)
When your standard ITC, SPR and DLS fall short: how a core facility solves its hardest cases with FIDA
How do you get a reliable answer from a protein sample that is too small, too fragile, or too complex for your standard toolkit? That is the daily reality of a biophysics core facility, and it is exactly where Flow Induced Dispersion Analysis (FIDA) has become surprisingly useful for the team at the Biozentrum, University of Basel.
In a Fidabio webinar, Dr. Timothy Sharpe, head of the biophysics facility at the Biozentrum, walked through a year of real cases where FIDA delivered answers that ITC, SPR, DLS, mass photometry and even analytical ultracentrifugation could not. He was joined by Dr. Thomas Bedwell, a field application scientist at Fidabio, and the session was hosted by Maja Wasilczyk. This post distils the practical lessons from that talk.
You can also watch the full webinar recording.
Why add FIDA to a facility that already has SPR, ITC, DLS and AUC?
The Basel facility serves around 100 users from roughly 40 research groups, with a toolkit that already spans circular dichroism, fluorescence spectroscopy, SPR, isothermal titration calorimetry (ITC), static and dynamic light scattering, mass photometry, analytical ultracentrifugation (AUC), differential scanning fluorimetry and microscale thermophoresis. So why add another instrument?
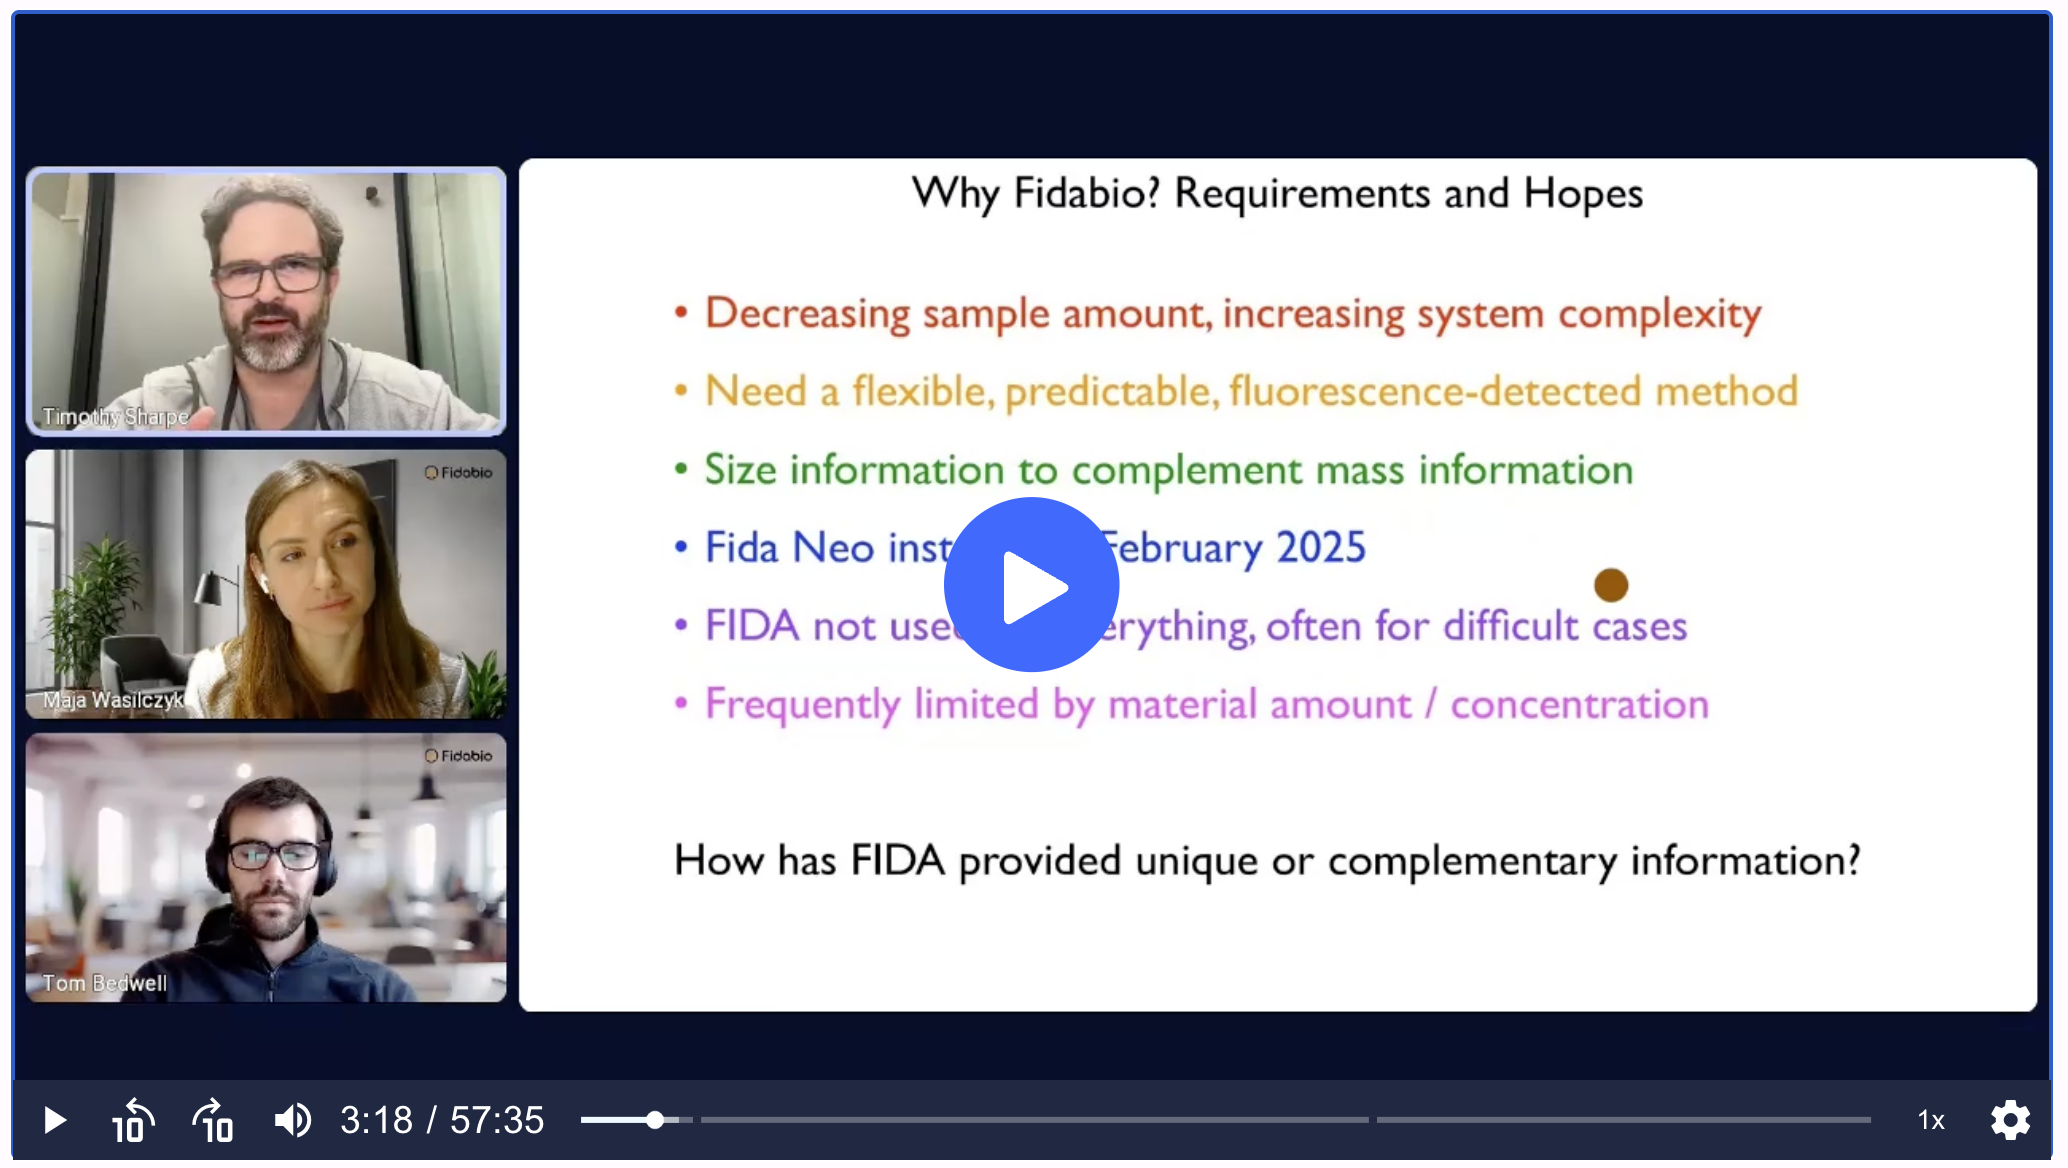
Two trends pushed the decision. First, the amount of sample people bring to biophysics keeps shrinking, partly because cryo-electron microscopy has lowered the material needed for structural biology. Second, the systems people want to measure are getting more complex. The facility needed a flexible, fluorescence-detected method that could work from tens of micrograms of low-concentration material, with a high chance of success on the first try and data that is easy to interpret. FIDA is an in-solution technique that measures the hydrodynamic radius (molecular size) and binding directly in solution, without immobilisation or purification, using microlitre-scale samples, which is precisely that gap.
“It does often end up being used for the most difficult cases where other techniques have failed, or where we have particularly complicated material,” Dr. Timothy Sharpe said.
Case 1: measuring a conformational change in 30 minutes instead of 12 hours
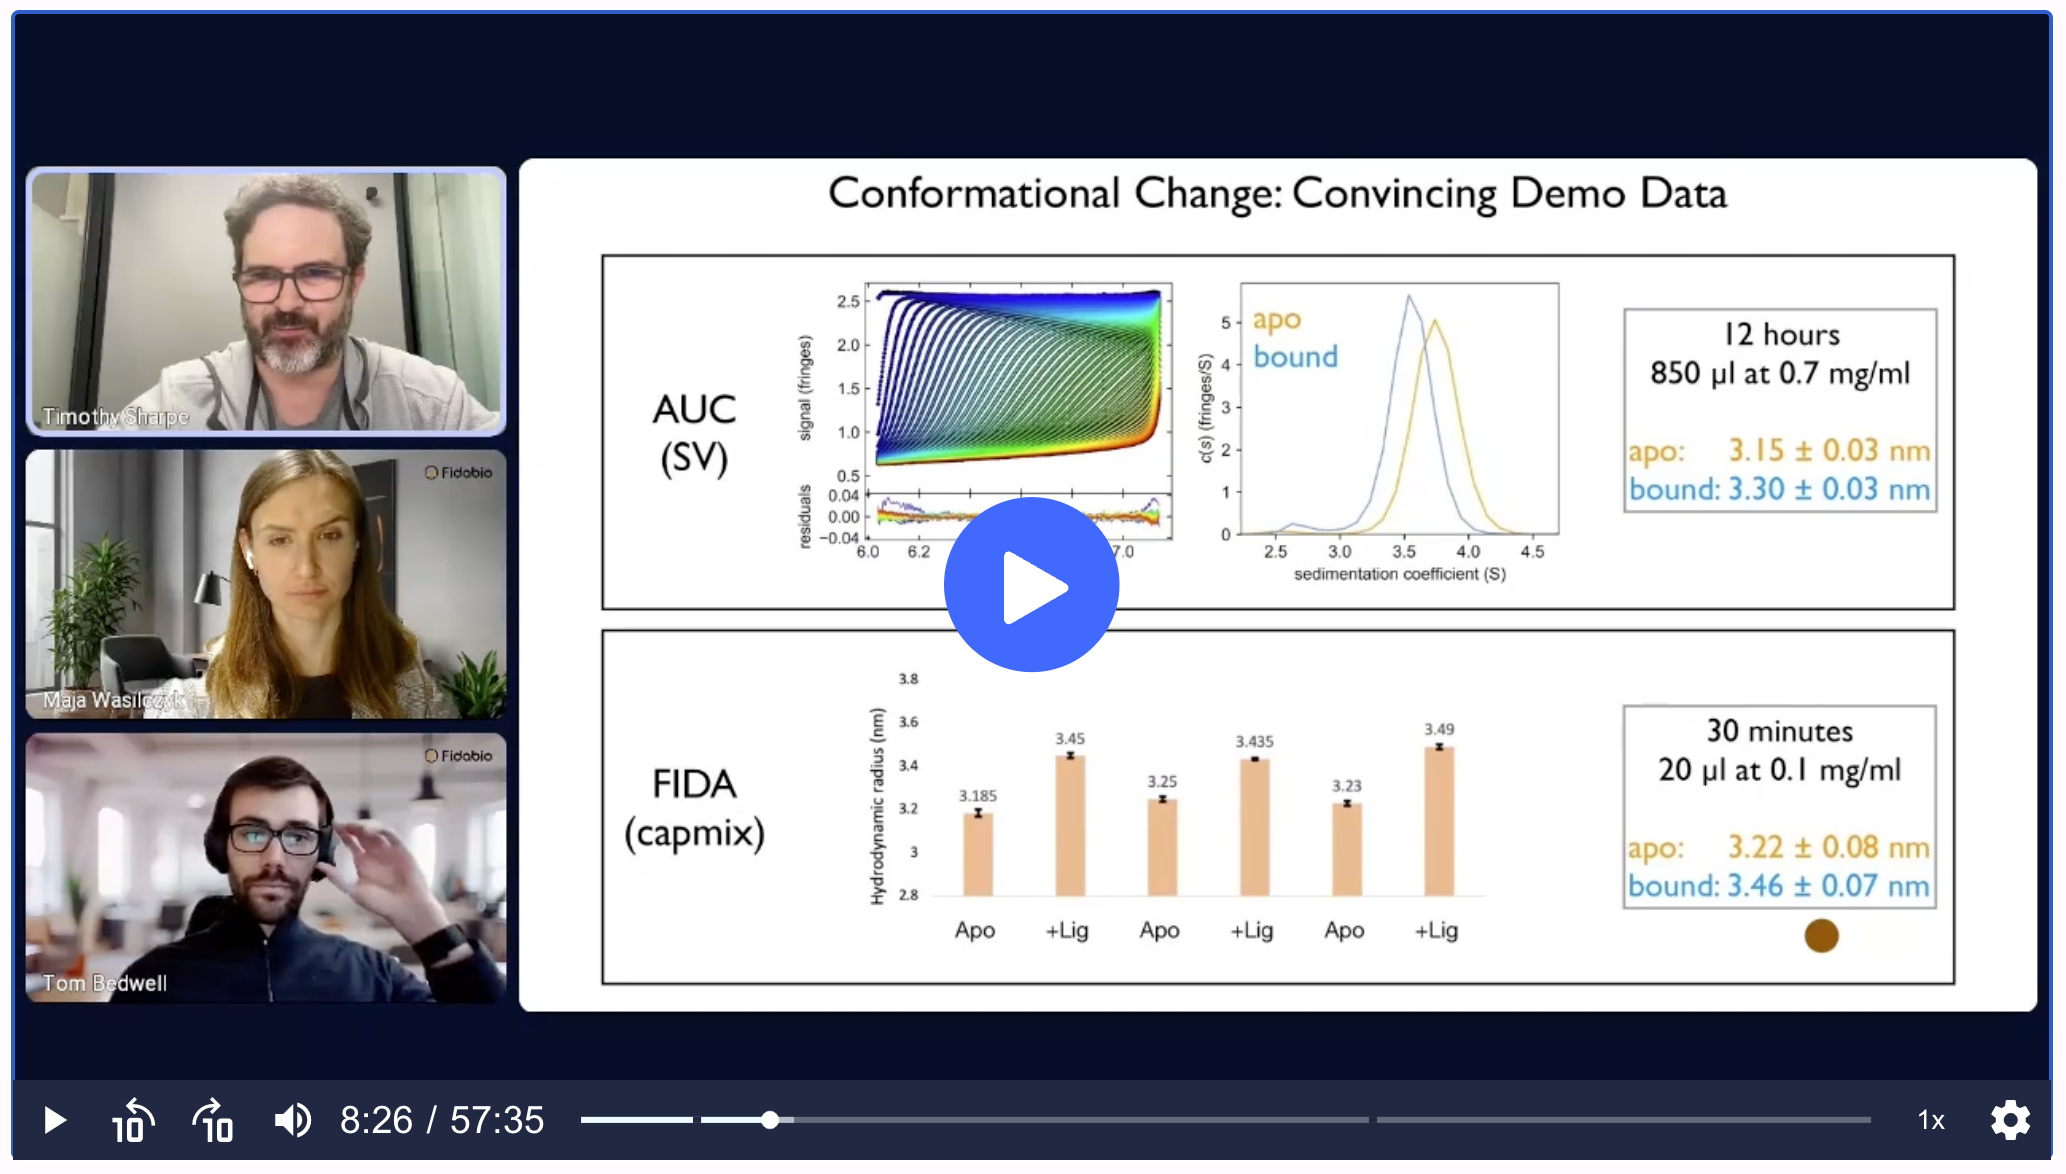
The facility had spent considerable time characterising a kinase that changes shape when it binds a small-molecule inhibitor, using AUC sedimentation velocity, an experiment that takes 8 to 12 hours and needs hundreds of microlitres at low milligram-per-millilitre concentrations. AUC showed the protein becoming less compact on binding, with the hydrodynamic radius moving from about 3.15 nm to 3.3 nm.
During the FIDA demo, the team reproduced the same result with a simple in-capillary mixing experiment: the apo protein at roughly 3.2 nm expanding to about 3.3 nm on binding. The difference was in the cost of the measurement, 30 minutes for all replicates, using just 20 microlitres at 0.1 mg/mL.
“This single set of data impressed me so much that I was certain we should get the instrument,” Dr. Timothy Sharpe said.
Case 2: getting a Kd when ITC, SPR, MST and SEC-MALS only hinted at binding
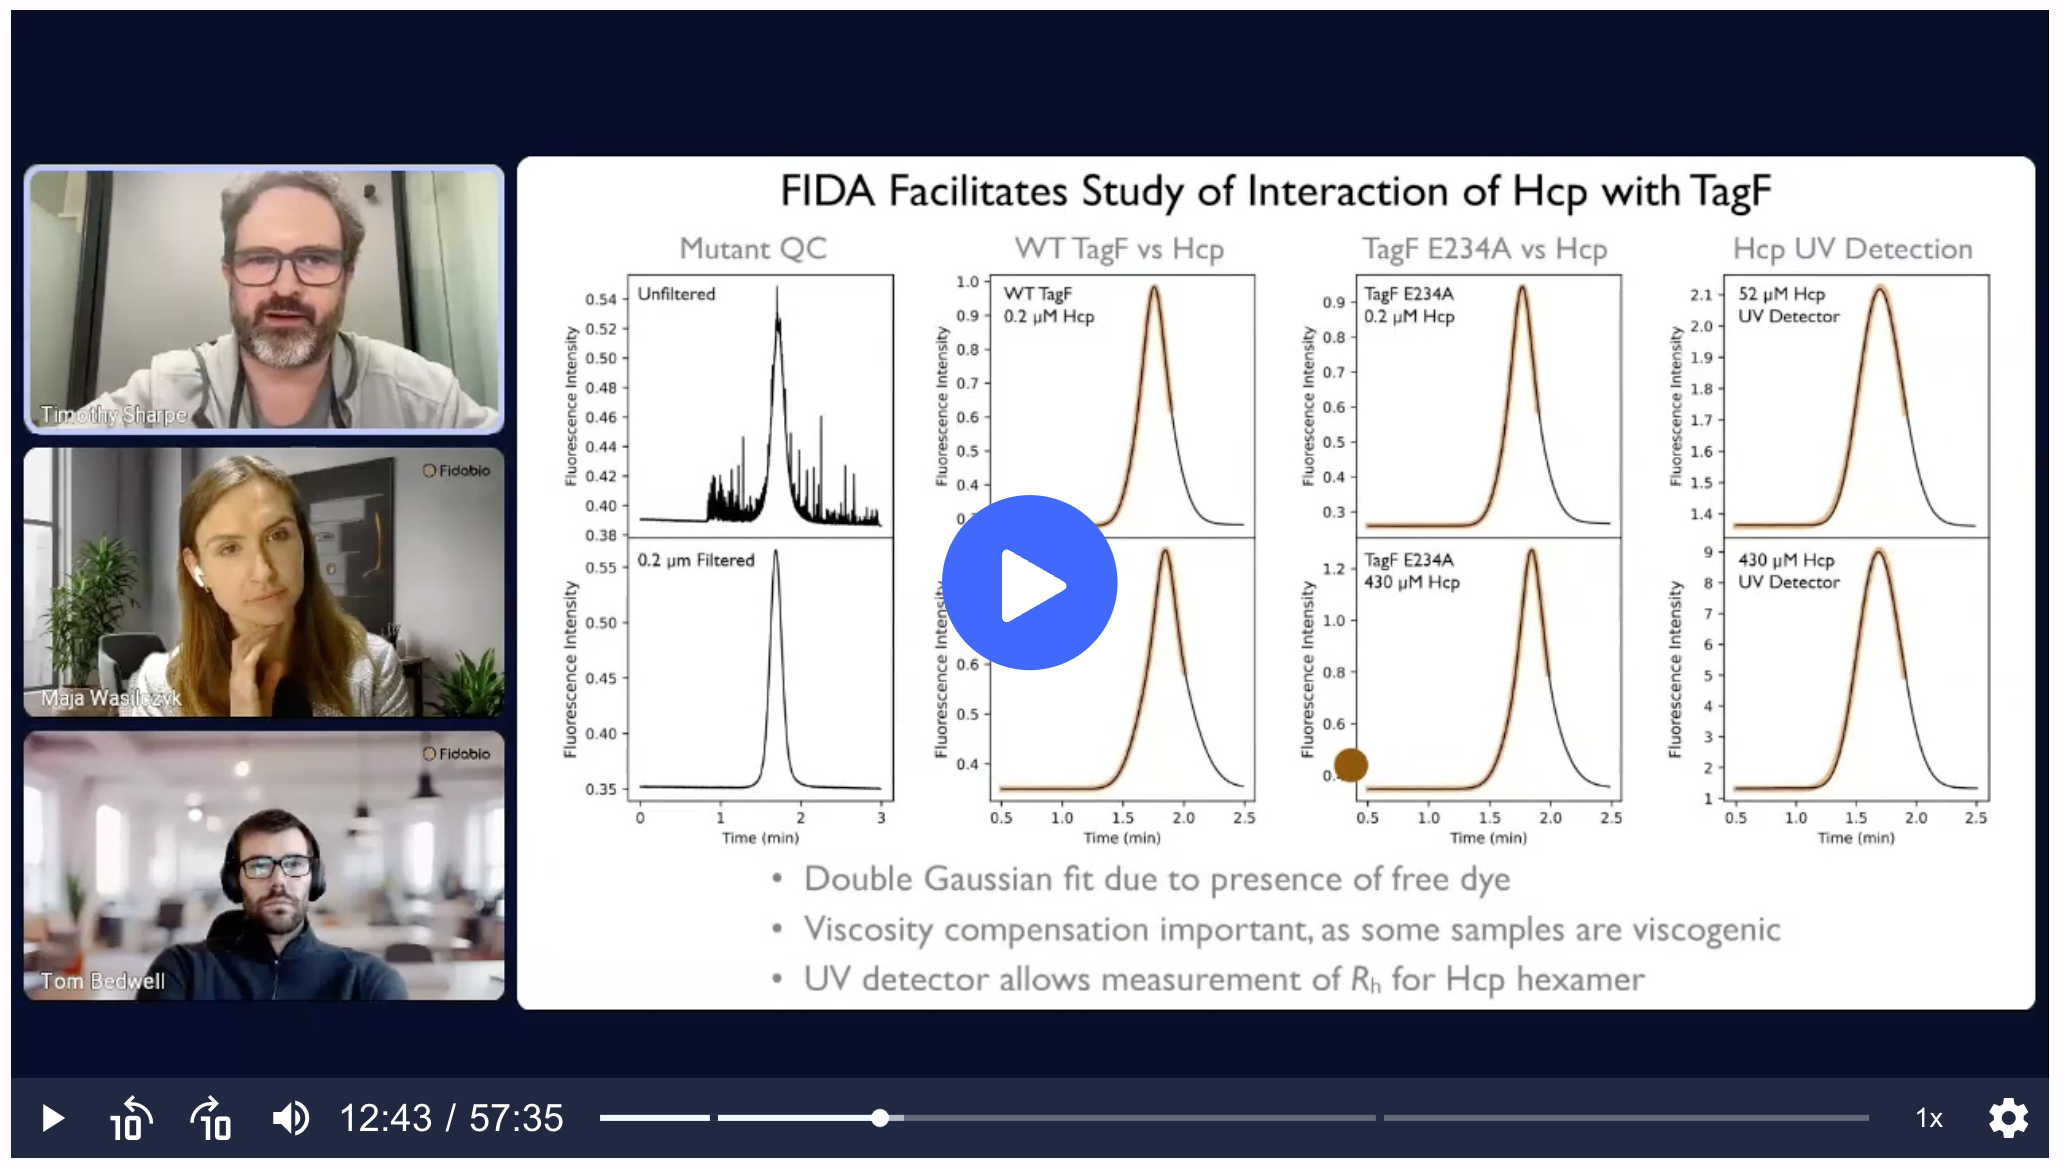
Two proteins from a bacterial type VI secretion system, a hexameric HCP protein (114 kDa) and a smaller TagF protein (37 kDa), were thought to interact, but the facility had tried ITC, mass photometry, SEC-MALS and microscale thermophoresis and obtained only hints of binding with no quantitative number.
“We had only hints of binding and no quantitative information at all. We were quite desperate for a method that could address this,” Dr. Timothy Sharpe said.
With FIDA, the team fluorescently labelled the smaller TagF protein and titrated it against HCP. Getting there took real biophysics: FIDA itself flagged aggregates in the freshly labelled protein (visible as spikes), which improved once detergent was added to the desalting buffer; a double-Gaussian fit handled the 30-40% free dye that could not be fully removed from the small sample; and viscosity compensation was needed at high titrant concentrations. The payoff was a measurable dissociation constant in the tens-of-micromolar range, the first time the interaction had been quantified for the isolated proteins in vitro. As a bonus, the hydrodynamic radius carried mechanistic clues: one mutant (E234A) showed a strikingly smaller complex size, hinting it may partly dissociate the complex.
Case 3: unpacking an AI-designed binder that would not behave
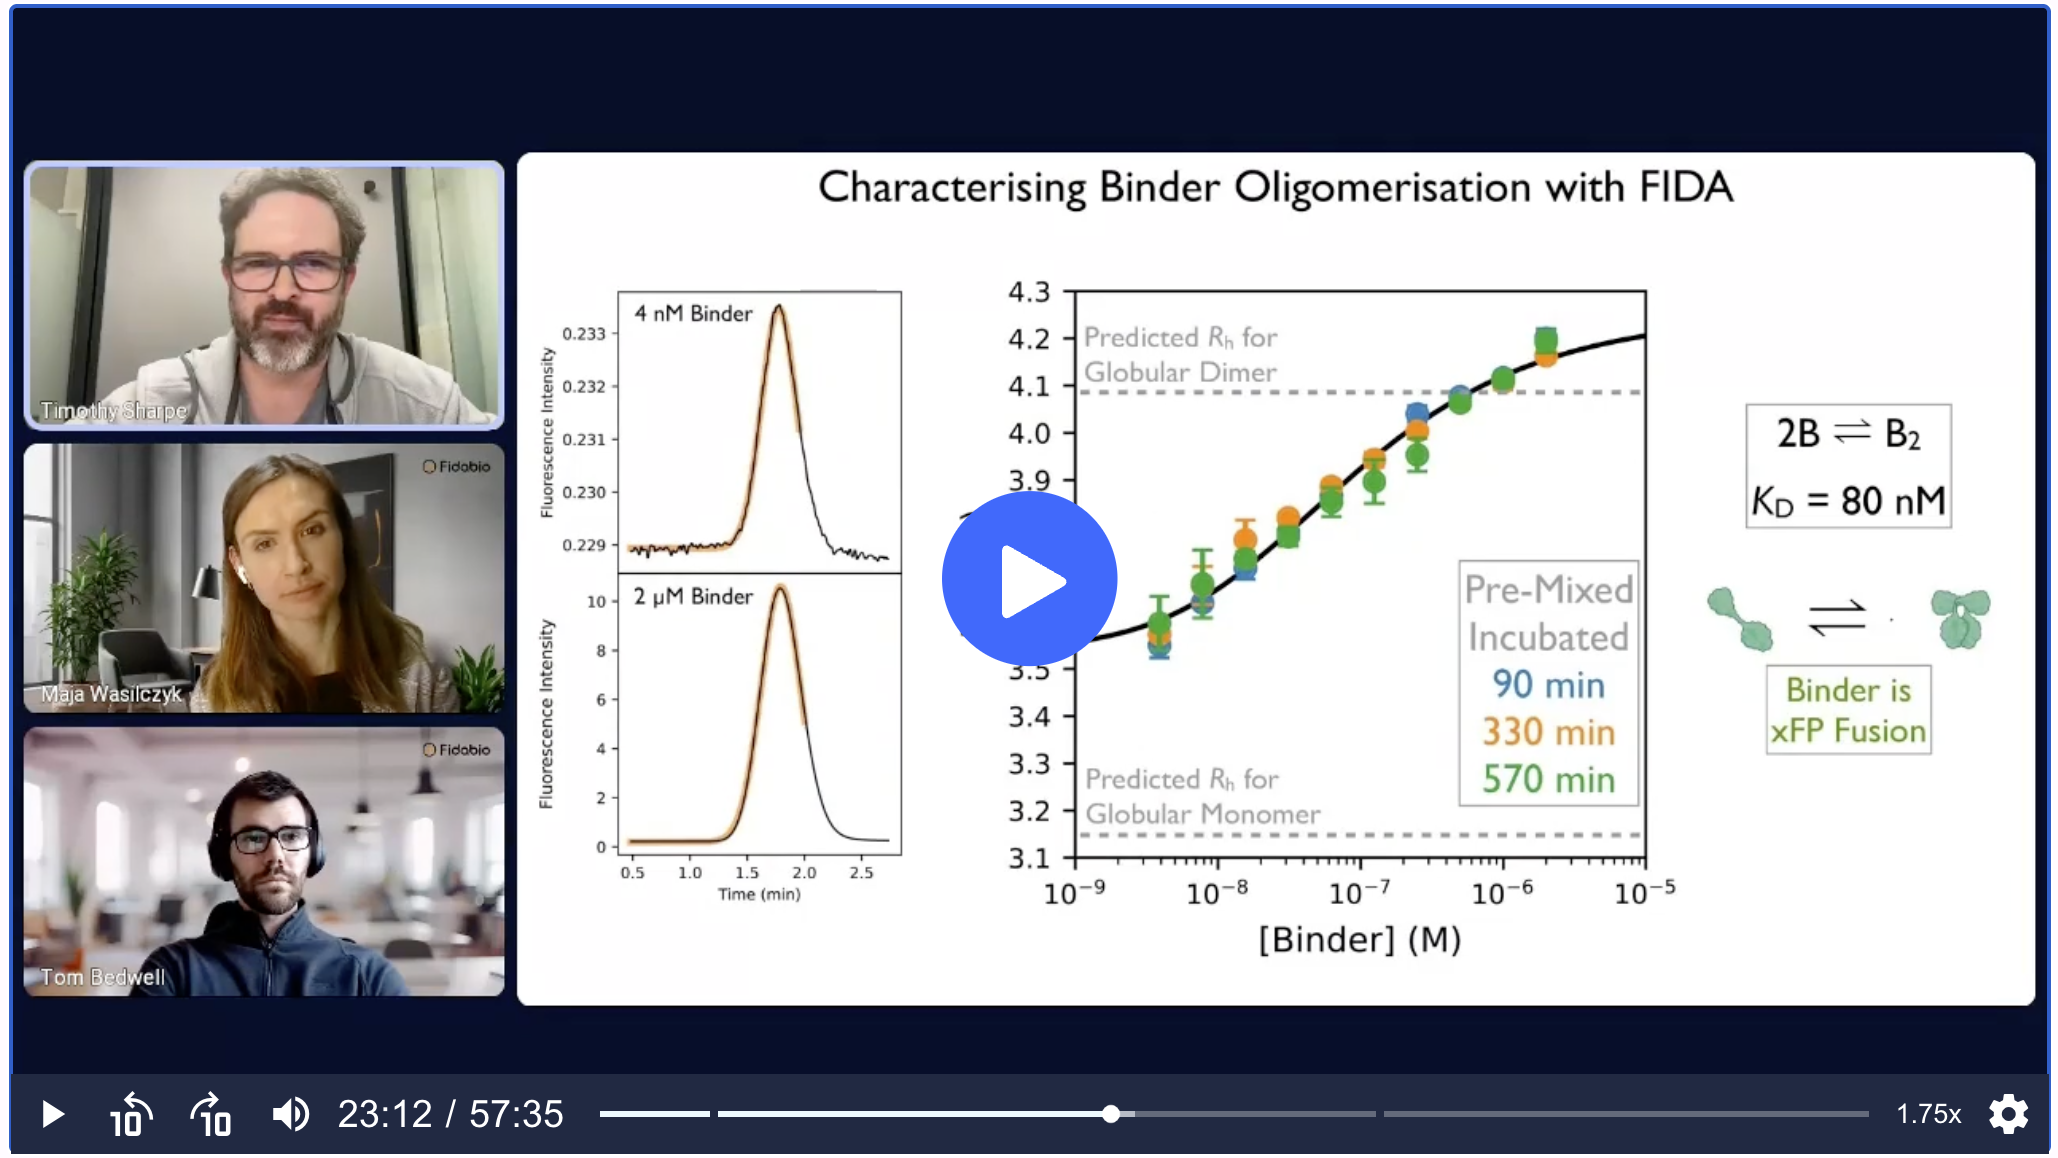
An AI-designed protein binder, a fluorescent fusion construct expected to be a 45 kDa monomer, turned out to be far more complicated. SEC-MALS revealed dimer, tetramer and hexamer species. Rather than abandon it, the facility used FIDA to titrate the binder against itself and map a monomer-dimer equilibrium with a Kd around 80 nM, reaching equilibrium after about 90 minutes. Measuring target binding at a low, mostly-monomeric concentration gave a Kd near 210 nM, but the hydrodynamic radius climbed well past what a simple one-to-one complex should give, revealing a higher-order or extended complex.
That is information other in-solution methods struggle to provide at nanomolar concentrations, and it fed straight back into the design cycle: the collaborators returned to the drawing board to engineer binders with cleaner behaviour.
Case 4: a brand-new system, antibody binding to a nanoparticle
Some of the most convincing evidence came from a system the facility had never worked on: immunoglobulin (IgG) binding to a micellar nanoparticle. A fractionally labelled nanoparticle read out at the expected 16.8 nm at low temperature, matching earlier DLS. At physiological temperature, FIDA revealed a larger 38 nm species alongside about 22% of the individual building block, an almost accidental readout of the nanoparticle’s thermal stability. Working at 25 °C, titrating human IgG gave a Kd in the tens-of-micromolar range (around 50 µM), limited only by how high the concentration could be pushed.
“That is the sort of system that used to slightly terrify me. With FIDA it feels fairly safe to try difficult systems, the sample is well isolated from the instrument, you can change the temperature, and you can easily replace the capillary,” Dr. Timothy Sharpe said.
Everyday quality control: seeing what other methods miss
Beyond difficult binding studies, FIDA quietly became a first-choice quality-control tool. Two examples stood out.
A 46 kDa protein bound for NMR showed unexpectedly broad line widths. SEC-MALS confirmed a pure monomer with a predicted radius of 2.7-3.0 nm, yet both DLS and FIDA agreed on about 3.6 nm, telling the group the monomer was simply more extended than expected, which explained its slow tumbling and broad lines. Mass and size together gave the answer.
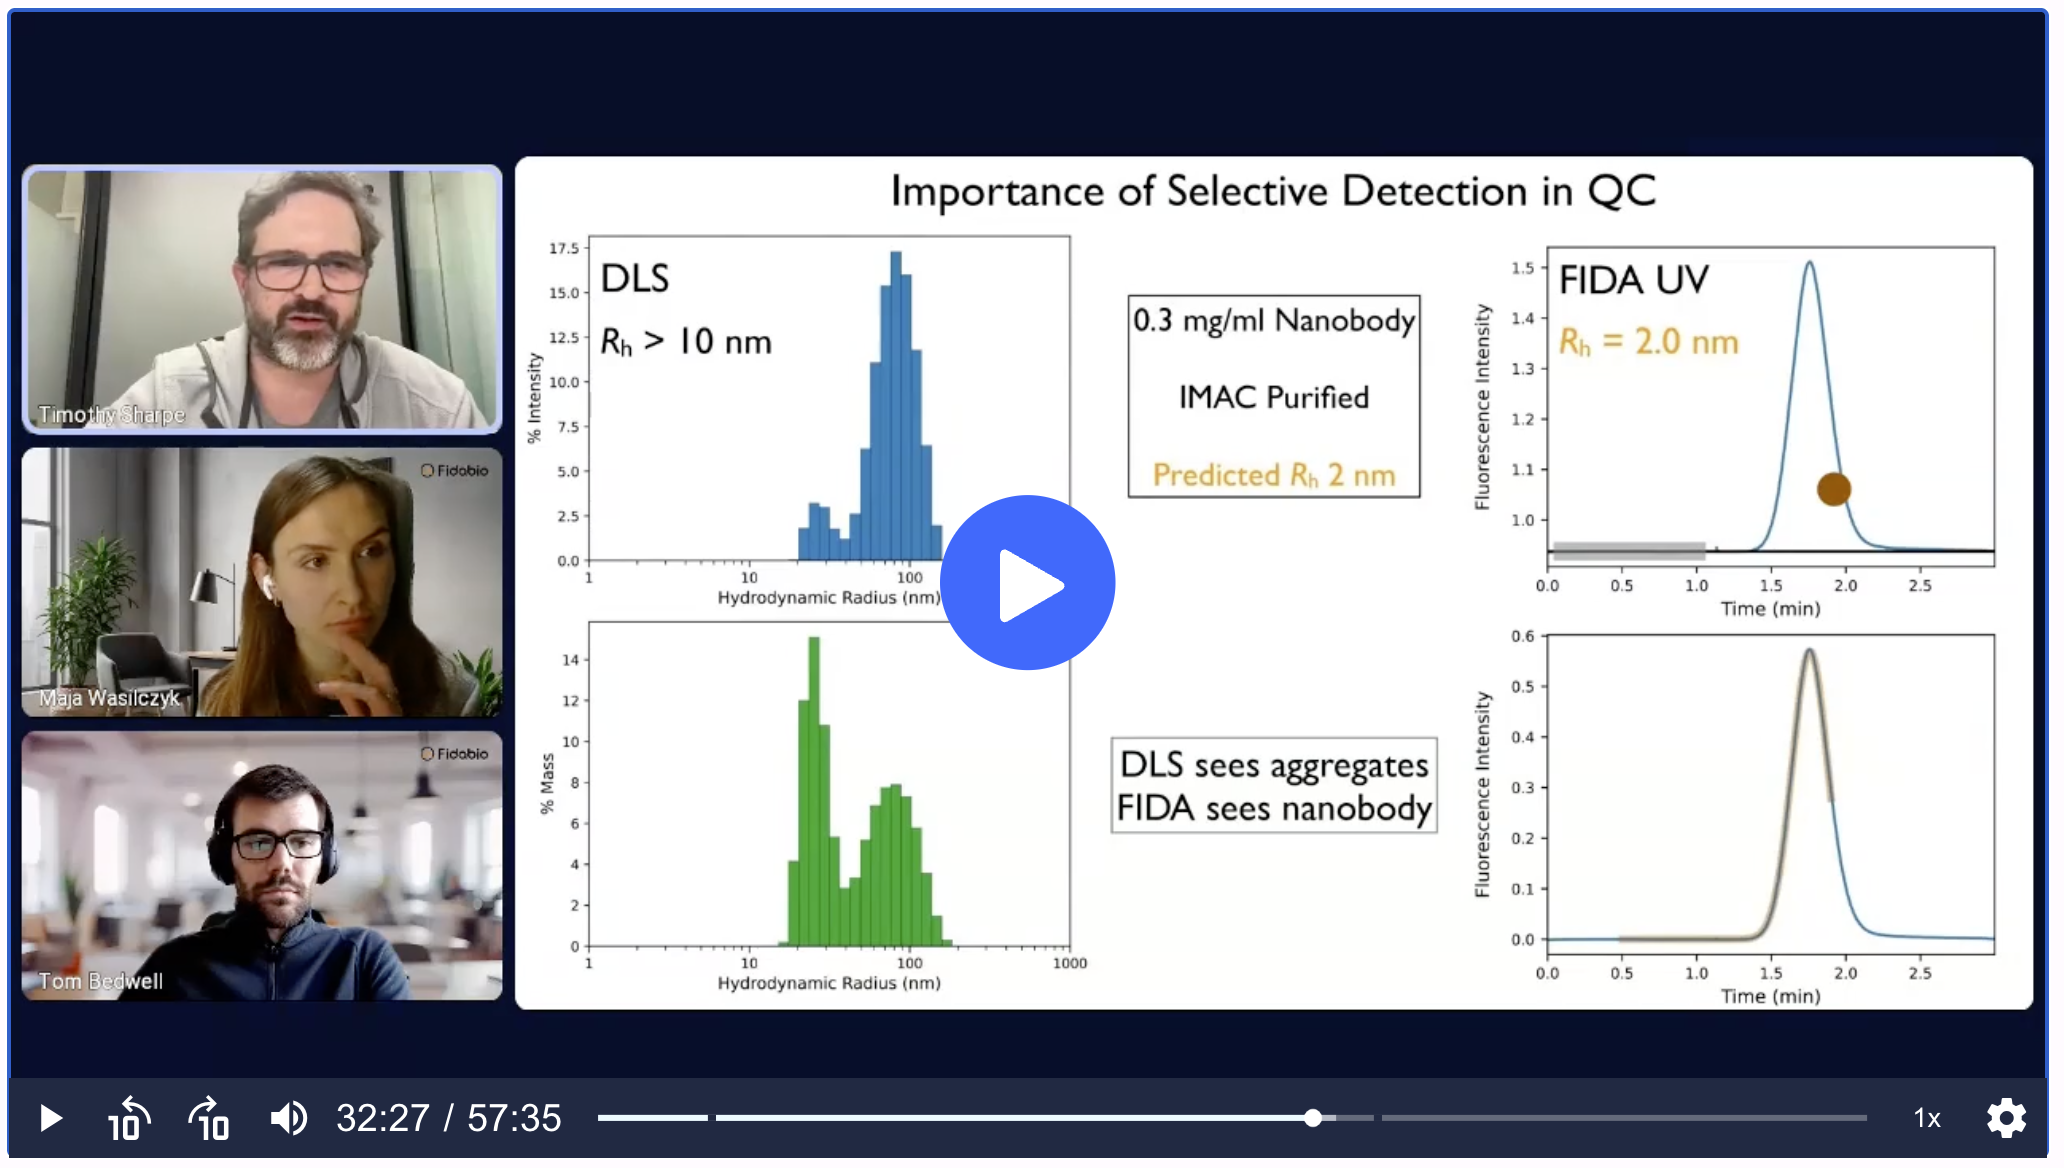
In a second case, a batch of nanobodies looked hopeless by DLS, where every species measured larger than 10 nm and suggested total aggregation. Because DLS is dominated by the largest, brightest scatterers, it can hide correctly folded protein. Running the same samples on FIDA, which detects only the fluorescent, proteinaceous species, showed that the majority of material sat right at the expected ~2 nm, with very little aggregate. The nanobodies were fine; the DLS signal had been swamped by non-fluorescent aggregates.
When does the facility reach for FIDA, and when not?
Asked directly about method choice, Dr. Sharpe was refreshingly candid, and the answer is a useful map for anyone weighing FIDA against a full biophysics toolkit:
On why they favour fluorescent detection over label-free measurement, the reason is selectivity: labelling one partner lets you follow a single species cleanly, which becomes essential in complex backgrounds like plasma or cell lysate.
The biggest surprises
Two things exceeded expectations. The first was using hydrodynamic radius to measure binding at all.
“I always used to think you can’t use hydrodynamic radius to measure binding, because it only scales with the third power of mass. What changed my mind is that with FIDA you can measure it selectively and accurately enough to robustly track small changes in radius, and use them to monitor binding,” Dr. Timothy Sharpe said.
The second was quality control. Spike counting, sizing and aggregation checks, capabilities the team assumed they would rarely use, have become a routine first response whenever a sample misbehaves, made even more powerful by the autosampler’s ability to rebuffer, screen conditions and run long automated series.
“It’s become our first choice for many applications, more than I originally envisaged. That’s the surprisingly useful part,” Dr. Timothy Sharpe said.
The takeaway for core facilities
FIDA is not a replacement for a well-equipped biophysics facility, it is the method that steps in when the sample is scarce, the system is complex, or the material is hard to purify. Because the hydrodynamic radius is a predictable, physically meaningful parameter rather than an arbitrary signal, it tells you not just that something is binding, but whether it is forming the complex you expect, or doing something unexpected worth chasing. For a facility measuring smaller and more complex samples every year, that has proved surprisingly useful.
Want to see how FIDA could fit your hardest cases? Explore the FIDA technology, the Fida instruments, or browse the peer-reviewed literature. You can also watch the full webinar with Dr. Timothy Sharpe.
.png)
.png)