How do you stop protein sticking to surfaces?
Protein sticking to surfaces is reduced by changing one of three things: the surface the protein meets, the additives in the buffer, or the buffer chemistry itself. The first thing to try is a different capillary, the second is a detergent or crowding agent, and the third is the buffer chemistry.
Changing the surface
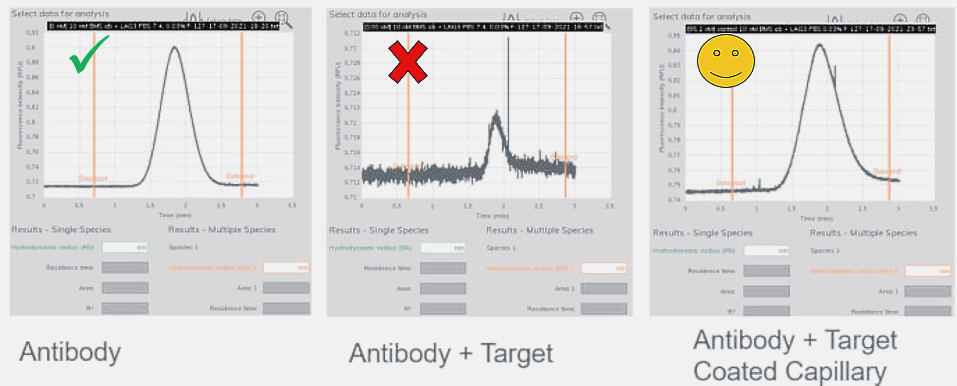
On a standard capillary the interaction is most likely between positive charges on the protein and the negative charge on glass. Fused silica, the material a measurement capillary is made from, has an induced negative charge on its inner surface. With stronger stickiness you may apply a dedicated, dynamic coating to regular capillaries, or use permanently coated capillaries. There are three options in all: the standard capillary (glass), the HS coated capillary (neutral hydrophilic), and the permanently coated PC1 capillary (high performance hydrophilic). These can be purchased at shop.fidabio.com (registered users only).
Mild stickiness requires no coating at all. Moderately sticky material can be run on regular capillaries, and the data analysis software tolerates mild stickiness without the readout being affected, so a coating is worth introducing when the data indicates it rather than as a default.
The capillary is not the only glass in the experiment. If a sample is sticky on a standard capillary it will also stick to the glass vials, which affects the injection concentration. Using plastic well plates is advisable in that case.
Adding a detergent or crowding agent
Reagents such as Pluronic acid, Tween 20 and bovine serum albumin (BSA) act as surfactants and aid in preventing sample adsorption to the surface. Fidabio has good experiences using 0.03 percent Pluronic F127 in the buffers, or up to 5 percent BSA when working with labelled samples. Where the problem is a gradual loss of fluorescence from adsorption to well plates or vials, adding 0.03 percent Pluronic F127 or Tween 20 can often mitigate the effect. These reagents may also diminish the tailing effect seen on FIDA Taylorgrams.
Changing the buffer chemistry
If a different capillary and an additive have both failed, the remaining approach is to change the charge relationship directly. Determine the charge of the protein by calculating its isoelectric point, then either change the pH of the buffer to reverse the charge, or increase the ionic strength of the buffer.
FIDA has a high buffer tolerance, so this kind of adjustment is generally available without rebuilding the assay around it.
On an HS or PC capillary many different molecular properties can cause stickiness. In that case, optimise the assay buffer by adding a combination of detergents, such as Tween 20 or other surfactants, or other additives such as salt or stabilising ions.
Matching the remedy to the symptom
A tailing peak indicates stickiness to the glass capillary, so the first steps are a coated capillary, or a change of pH or salt. A signal that drops when the binding partner is added indicates that the analyte is adsorbing to the capillary and taking the indicator-analyte complex with it, and measuring in a coated capillary restores the fluorescence. A signal that fades across repeated measurements of the same sample indicates adsorption to well plates or vials rather than to the capillary, which 0.03 percent Pluronic F127 or Tween 20 can often mitigate. A peak that arrives late in a sample that should have the viscosity of water indicates extreme stickiness, which is again a case for trying a different capillary first.
When stickiness cannot be fully resolved
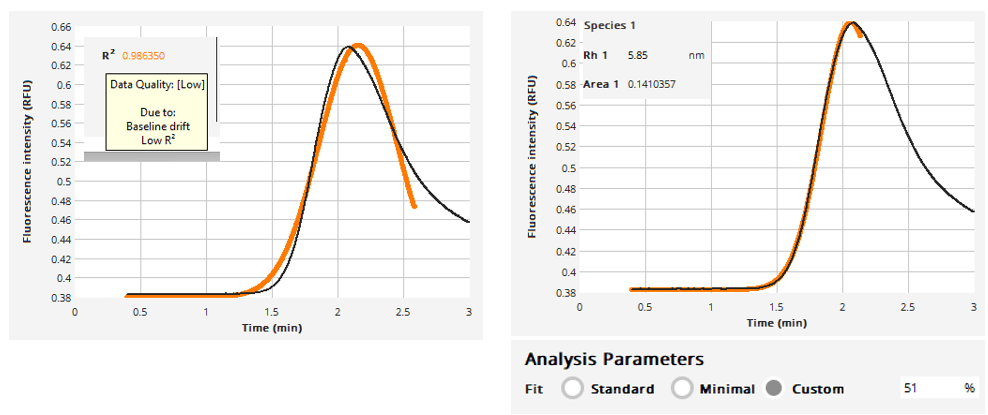
It is still possible to obtain a hydrodynamic radius when sample stickiness is not fully resolved. Apply the custom fit option and select the percentage of the peak to analyse, for example 51 percent. The software fits the selected portion, assumes symmetry for the remaining half, and calculates the radius from the reconstructed peak profile. Stickiness does not impact FIDA experiments, though sizing is more reliable when stickiness is minimised.
How FIDA supports this
In FIDA it is immediately clear when stickiness reaches a level that might disturb the data readout. Tailing, loss of signal on analyte addition and loss of signal over time are distinguishable in the raw data, so the relevant variable can be changed first. The effect of the change is then visible in the same measurement: a symmetric gaussian on a coated capillary confirms that the surface was the cause. Detecting the tendency in the first place is what enables appropriate measures to be taken to prevent it.
Because nothing is immobilised, the remedies are changes to buffer and capillary rather than changes to the assay format, and because each data point consumes nanolitre volumes, screening several conditions does not require large amounts of material. Further reading: Sample Stickiness readout and What is protein stickiness?
Related resources
The application note Assessment of Sample Quality with Every Measurement shows stickiness alongside the other parameters returned by the same run, and the infographic Quality Control: 8 Parameters in 4 Minutes summarises them. The case discussion Solving difficult cases at core facilities from the Biozentrum Basel covers awkward samples in practice.
On this site: What is protein stickiness?, the Sample Stickiness readout and What is sample viscosity?